Band 5.5 IELTS Writing Task 1 Model Answer
Overall Band Score: 5.5 · Cambridge IELTS 20 · 2026-11-08
IELTS Writing Task 1 question
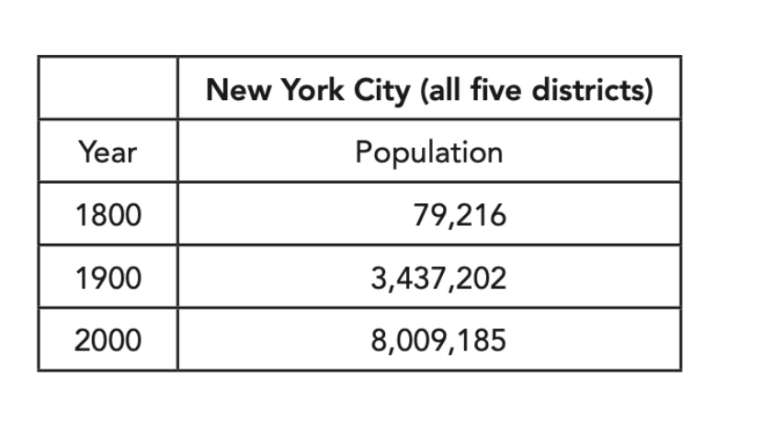
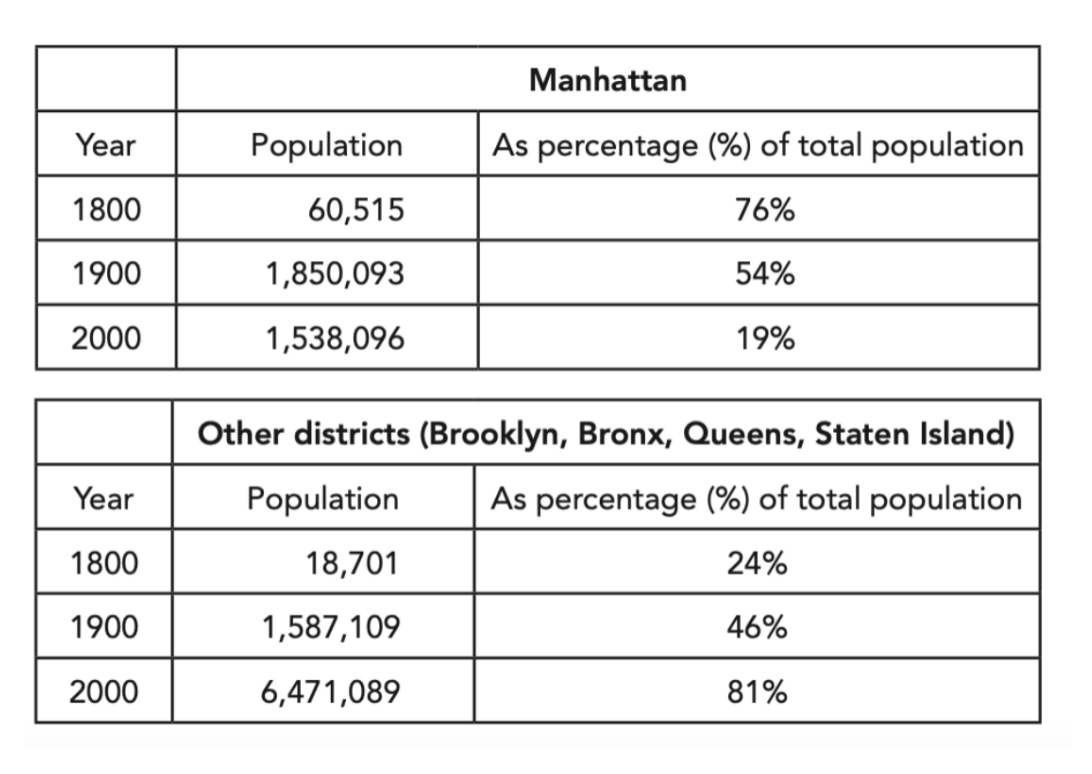
The first table below shows changes in the total population of New York City from 1800 to 2000. The second and third tables show changes in the population of the five districts of the city (Manhattan, Brooklyn, Bronx, Queens, Staten Island) over the same period.
Summarise the information by selecting and reporting the main features, and make comparisons where relevant.
Student answer (Band 5.5)
The provided tables illustrate the outcomes of total population changes between 1800 to 2000 Also Modifications of the districts of the city (Manhattan, Brooklyn, Bronx, Queens, Staten Island) in same time period.
Overall, total population in 2000 is the highest than all of the years Also according to the district data in manhattan year 1800 had the highest percentage but percentage of total population of other districts high in 2000. The lowest population in newyork city and other ditricts present in 1800 but according to manhattan 2000 is very low in percentage.
Regarding population of the newyork city had been decreased every year. Starting with year 1800 the population is 79,216 followed by this in next year 1900 population is 3,437,202 moreover in 2000 population had been the greatest of all years was 8,009,185.
In terms of districts, only in mantattan is different from all the others dtricts. Year 2000 had been the lowest percentage which is 19% respectively in 1900 it incresed by 54% but more of the population was present in earlier year 1800. Furthermore, other ditricts increase every year. 1800 year had 24% but it grow upto 46% in 1900 and end upto 81% in 2000.
AI examiner evaluation
| Criterion | Band |
|---|---|
| Task Achievement / Task Response | 5.5 |
| Coherence and Cohesion | 5.5 |
| Lexical Resource | 5.0 |
| Grammatical Range and Accuracy | 5.0 |
| Overall | 5.5 |
Task Achievement / Task Response: Band 5.5
You identify the broad pattern that New York City’s population was highest in 2000 and that Manhattan’s share fell while the other districts’ share rose. You also include several accurate figures, such as the city totals and the district percentages. However, the overview is not consistently clear: saying the city population “had been decreased every year” contradicts the figures, which show a steep increase. The response also omits Manhattan’s actual population figures and does not clearly report that its population rose to 1,850,093 in 1900 before falling to 1,538,096 in 2000. To strengthen the summary, select the main contrasts accurately and distinguish population totals from percentage shares.
Coherence and Cohesion: Band 5.5
The response has a recognisable structure, with an introduction, an overview, and separate paragraphs for the city total and district data. This gives the reader some sense of how the information is organised. However, progression is weakened by contradictory statements and unclear links: the overview says the total population was highest in 2000, but the next paragraph claims it “had been decreased every year.” Connectors such as “Also,” “moreover,” and “Furthermore” are repeated or do not clearly show the relationship between ideas. Some references, including “it” and “the others,” are also vague. Organise the figures in a clear chronological comparison and use linking phrases only where they accurately express contrast, sequence, or addition.
Lexical Resource: Band 5.0
You use some relevant vocabulary for describing tables, including “population,” “percentage,” “districts,” and “increase,” so the topic is generally understandable. However, the range is limited and several word choices or collocations are inaccurate, which sometimes makes the meaning difficult to follow. For example, “outcomes of total population changes” is an awkward description, and “the highest than all of the years” does not express the comparison naturally. There are also noticeable spelling errors, such as “mantattan,” “ditricts,” and “incresed.” Aim for precise, conventional language for data reporting, and check spelling and word forms carefully. The suggestions below offer more natural alternatives for some phrases.
Grammatical Range and Accuracy: Band 5.0
You attempt both simple and longer sentence forms, and the response is divided into sentences that usually convey the intended topic. However, control is inconsistent, especially in longer constructions. For example, “the population is 79,216 followed by this in next year 1900 population is 3,437,202” has faulty sentence structure and missing grammatical words. Tense and agreement are also problematic in “population … had been decreased” and “it grow upto 46%.” Articles and prepositions are often omitted or misused, as in “in same time period” and “in earlier year 1800.” Use straightforward past-tense sentences to report the historical data, then check each sentence for a clear subject and verb, correct tense, and necessary articles.
See this exact question answered at other band scores. The same prompt compared across bands.
Browse more IELTS Writing model answers or get your own writing scored by the same AI examiner.