Band 5.0 IELTS Writing Task 1 Model Answer
Overall Band Score: 5.0 · Cambridge IELTS 20 · 2026-11-08
IELTS Writing Task 1 question
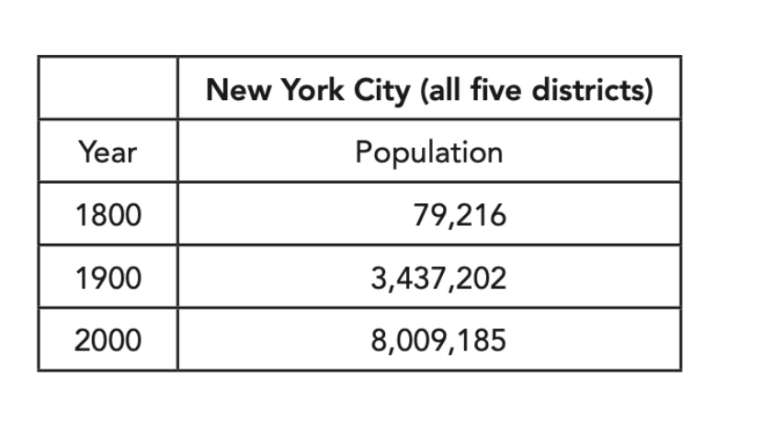
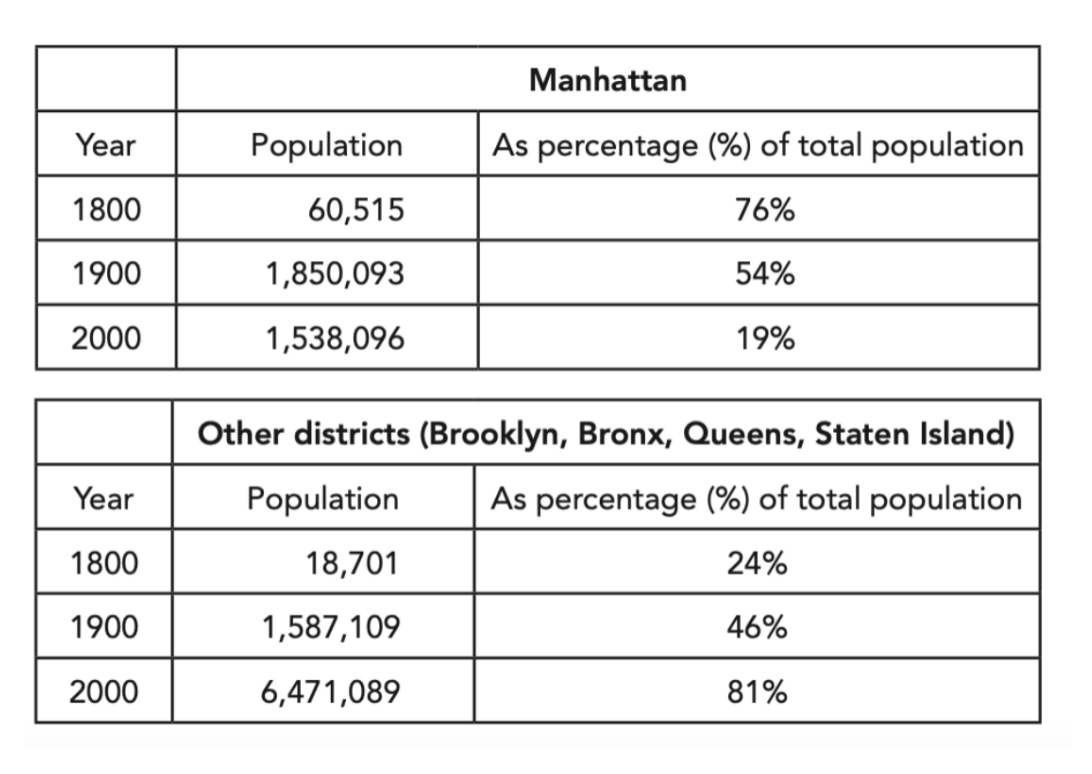
The first table below shows changes in the total population of New York City from 1800 to 2000. The second and third tables show changes in the population of the five districts of the city (Manhattan, Brooklyn, Bronx, Queens, Staten Island) over the same period.
Summarise the information by selecting and reporting the main features, and make comparisons where relevant.
Student answer (Band 5.0)
The given first table describes population of the New York city between the year 1800 to 2000 as well the second and the third table descrbes the population of five districts of the given cities over the same duration
.
Overall, the table (Manhatta ) shows that in 1800 , population of is 76% that is good but it decrease until 2000.As the table (Others districts) are less in number in the total population. However, it gradually increase in the population from 1800 to 2000 in the other districts like Brooklyn, Bronx and others.
As we can see the first table (Manhattan) clears the incerse in the population from 1800 till 2000. In the year 1800, the popultion of Manhattan is 76% of the total population and its around 60,515. and it decreases to 22% in 1900 and Inthe year 2000 it becomes 19% of total population that shows the decrese in poption from the total poption of New York.
However, the second table is inversonaly proptional to the first table as you can see that in first table the population is higher in Mehattan as compared th
AI examiner evaluation
| Criterion | Band |
|---|---|
| Task Achievement / Task Response | 5.0 |
| Coherence and Cohesion | 4.0 |
| Lexical Resource | 5.0 |
| Grammatical Range and Accuracy | 5.0 |
| Overall | 5.0 |
Task Achievement / Task Response: Band 5.0
You identify the broad contrast between Manhattan’s declining share and the other districts’ growing share, which is a relevant overview. However, the response only partially reports the tables: it gives Manhattan’s figures for 1800 and 2000 but does not accurately report the 1900 share, which was 54%, not 22%. It also says Manhattan’s population “clears the increase” through the period, although its population fell from 1,850,093 in 1900 to 1,538,096 in 2000. The overall city’s growth from 79,216 to 8,009,185 and the other districts’ rise to 6,471,089 are not clearly described. To develop the report, select the main changes, use accurate figures, and compare both population totals and percentages.
Coherence and Cohesion: Band 4.0
There is an attempt to organise the response into an introduction, an overview and detail, and linking expressions such as “Overall” and “However” show an effort to connect ideas. Nevertheless, progression is difficult to follow because the overview contains unclear or contradictory statements, and the final paragraph ends mid-sentence (“as compared th”). References such as “the first table” are also confusing because the first table is the citywide total, while the later discussion uses this label for Manhattan. Improve the sequence by presenting the citywide trend first, then comparing Manhattan with the other districts. Use clear paragraphing and complete each comparison before moving on.
Lexical Resource: Band 5.0
The response uses some relevant task vocabulary, including “population,” “total population,” “districts,” and “decrease,” so the topic is generally recognisable. However, the range is limited and several spelling and word-choice errors make parts difficult to understand, such as “Manhatta,” “incer se,” “popultion,” and “inversionaly proptional.” Some phrases are also unnatural or imprecise, including “population … is 76%” and “that is good,” which does not describe a data trend appropriately. Aim for accurate terms such as “accounted for,” “share,” and “rose/fell,” and check spelling carefully. Avoid repeating “population” where a more precise reference, such as “figure” or “proportion,” would be clearer.
Grammatical Range and Accuracy: Band 5.0
You attempt both simple and more extended sentences, including a comparison introduced by “However,” but control is inconsistent. Errors in sentence structure and verb forms appear in examples such as “between the year 1800 to 2000,” “it decrease,” and “it gradually increase.” Articles and sentence construction are also problematic in “population of is 76%,” while punctuation and spacing interrupt several sentences. These errors sometimes make the intended relationship between figures unclear. Practise forming accurate comparison sentences, for example, “Manhattan’s share fell from 76% in 1800 to 54% in 1900.” Use consistent past-tense verbs for the historical data and check that each sentence has a complete subject and verb.
See this exact question answered at other band scores. The same prompt compared across bands.
Browse more IELTS Writing model answers or get your own writing scored by the same AI examiner.