Band 5.0 IELTS Writing Task 1 Model Answer
Overall Band Score: 5.0 · Cambridge IELTS 20 · 2026-11-08
IELTS Writing Task 1 question
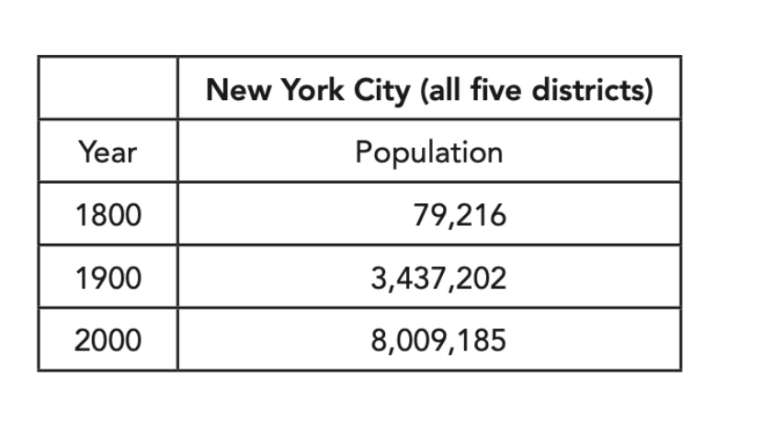
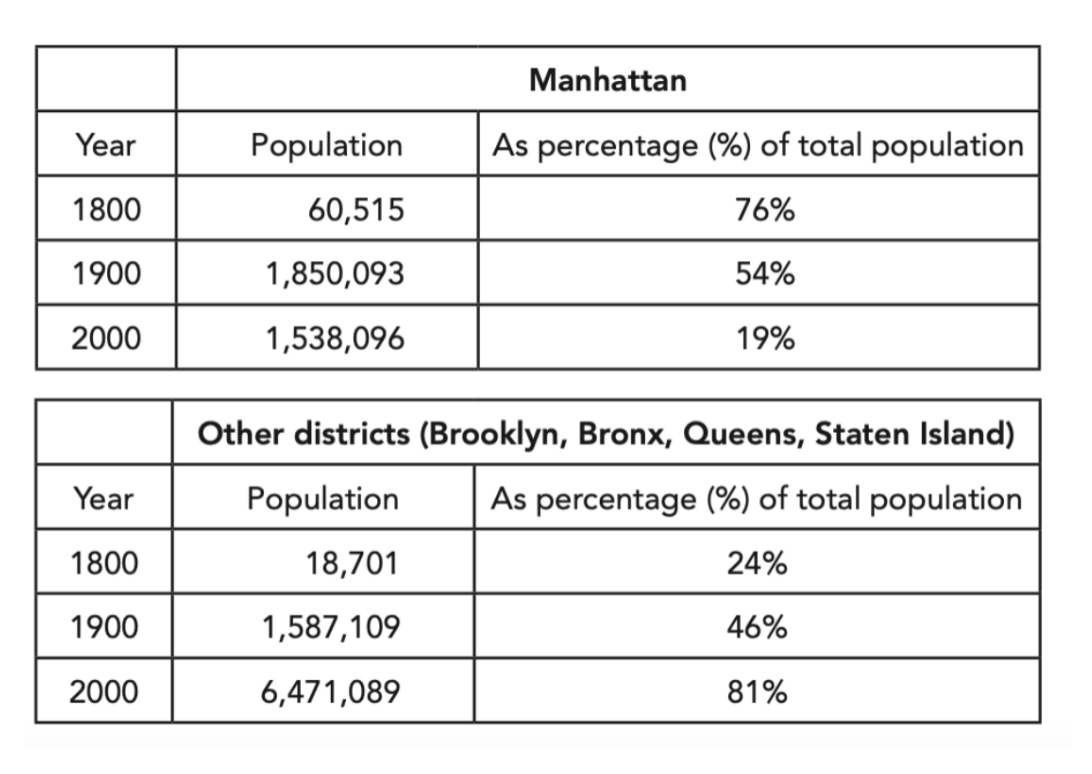
The first table below shows changes in the total population of New York City from 1800 to 2000. The second and third tables show changes in the population of the five districts of the city (Manhattan, Brooklyn, Bronx, Queens, Staten Island) over the same period.
Summarise the information by selecting and reporting the main features, and make comparisons where relevant.
Student answer (Band 5.0)
The tables illustrates the data population of New York, Manhattanand other districts such as like ( Brooklyn, bronx, queens, staten island) from the year of 1800 to 2000.
The first table it is of new york with mentioned year and popluation. In 1800, the popluation was 79,216 and in the year 1900, it was around 3,437,202. In the year 200 it is 8,009,185.
The second table it is of manhattan.In 1800, the popluation was 60,515 and in the year 1900, it was around 1,850,093. In the year 200 it is 1,538,096.
The third table it is of other districts including (brooklyn, bronx, queens, staten island).In 1800, the popluation was 18,701 and in the year 1900, it was around 1,587,109. In the year 200 it is 6,471,089.
Overall, it shows the popluation with number of people and percentage. In Manhattan the higgest popluation was in the year in 1800 with 76% and least was in the year 2000 with 19%. In other discrits the hiigest popluation was in the year 2000 with 81% and least was in the year 1800 with 24%. This all the comparison of popluation of different cities in different year.
AI examiner evaluation
| Criterion | Band |
|---|---|
| Task Achievement / Task Response | 5.5 |
| Coherence and Cohesion | 5.5 |
| Lexical Resource | 5.0 |
| Grammatical Range and Accuracy | 4.5 |
| Overall | 5.0 |
Task Achievement / Task Response: Band 5.5
You report the main figures for all three tables, and the comparisons between Manhattan and the other districts are relevant. The overview also identifies the shift in their shares: Manhattan falls from 76% to 19%, while the other districts rise from 24% to 81%. However, the response is largely a sequence of figures rather than a clear summary of the main trends. For example, it does not explicitly highlight that New York’s total population grew substantially across the period, or that Manhattan’s population peaked in 1900 before declining by 2000. The phrase “highest population” is also imprecise when referring to percentages. Grouping the key changes and making these trends explicit would make the response more complete and better focused.
Coherence and Cohesion: Band 5.5
The response has a basic, understandable structure: it introduces the tables, gives a paragraph for each, and ends with an overview. This makes the information relatively easy to locate. However, progression is limited because the three body paragraphs repeat almost the same pattern—“In 1800… in the year 1900… in the year 200…”—without connecting the figures into a comparison. The overview comes after the detailed figures and repeats some information rather than drawing the main trends together. Some references are also unclear, as in “This all the comparison of population of different cities,” particularly since the data concern districts and the whole city. Use clearer linking and comparison phrases, and organise the body around changes and contrasts rather than listing each table separately.
Lexical Resource: Band 5.0
You use enough basic vocabulary to identify the subject and report population figures, including “population,” “percentage,” “districts,” and “comparison.” However, the range is limited and several words or phrases are repeated, especially “in the year” and “population.” There are also noticeable spelling errors, such as “popluation,” “higgest,” “discrits,” and “hiigest,” as well as awkward or inaccurate expressions such as “the data population” and “different cities” for the districts. These choices sometimes make the meaning less clear or the description less precise. Build a small set of accurate trend and comparison terms, such as “rose,” “declined,” “accounted for,” and “whereas,” and check spelling and collocations carefully.
Grammatical Range and Accuracy: Band 4.5
Most sentences use simple patterns, and the figures can generally be understood, but grammatical errors are frequent and the range of structures is narrow. The opening, “The tables illustrates,” has subject–verb disagreement, while “The first table it is of new york” uses an unnecessary subject and an incorrect sentence pattern. Other examples include “In the year 200 it is 8,009,185,” where the year and tense are inaccurate, and “This all the comparison,” which is missing a verb. Punctuation and spacing are also inconsistent, particularly around sentence boundaries. Practise accurate past-tense reporting and straightforward comparison structures, for example, “The population rose to…,” and proofread each sentence for a clear subject and verb.
See this exact question answered at other band scores. The same prompt compared across bands.
Browse more IELTS Writing model answers or get your own writing scored by the same AI examiner.