Band 5.0 IELTS Writing Task 1 Model Answer
Overall Band Score: 5.0 · Cambridge IELTS 20 · 2026-11-08
IELTS Writing Task 1 question
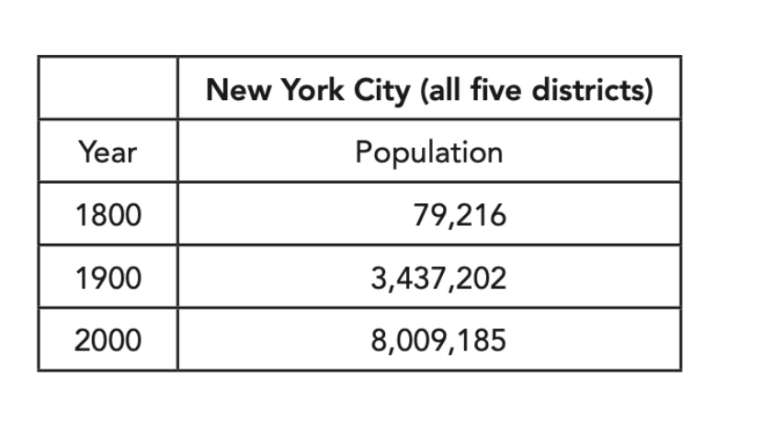
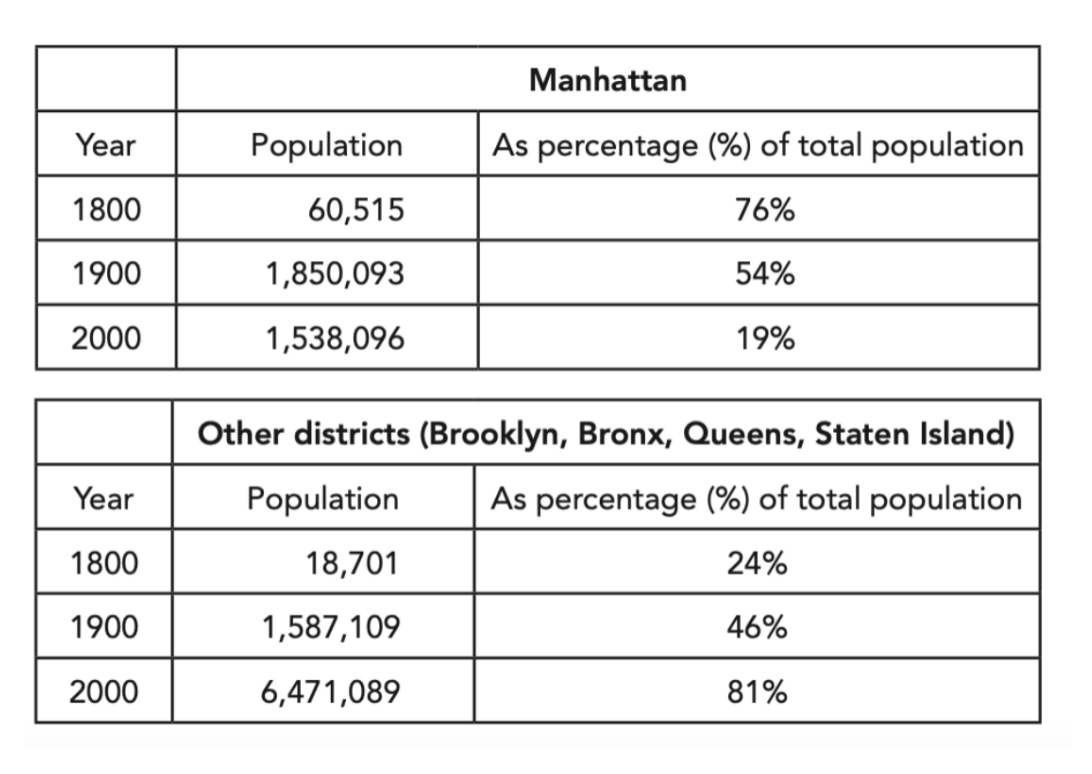
The first table below shows changes in the total population of New York City from 1800 to 2000. The second and third tables show changes in the population of the five districts of the city (Manhattan, Brooklyn, Bronx, Queens, Staten Island) over the same period.
Summarise the information by selecting and reporting the main features, and make comparisons where relevant.
Student answer (Band 5.0)
The first table shows the numbers of total population of New York City from 1800 to 2000, while the second one shows its districts population during that period.
Overall, city population was very low in 1800 but very high after 200 years. When we talk look at the districts, Manhattan was highest with 76%. The other four districts were only 24% of the total city population in 1800, but totally opposite in 2000.
The first one illustrated whole numbers of people in the city within 200 years of history. As we can see huge increase from 1800 to 1900, after hundred years it was more than double in 2000. Clearly, the increase in population is way too much.
Second table shows total numbers of people in New York City in detail along with its districts. In 1800, Manhattan was 76% of total people, while the other districts were 24% of it. After 200 years Manhattan population dropped to 19%, while the other four districts made it to 81% of total.
AI examiner evaluation
| Criterion | Band |
|---|---|
| Task Achievement / Task Response | 6.0 |
| Coherence and Cohesion | 4.5 |
| Lexical Resource | 5.0 |
| Grammatical Range and Accuracy | 5.0 |
| Overall | 5.0 |
Task Achievement / Task Response: Band 6.0
You identify the main overall changes: New York City’s population grew substantially, and the balance shifted from Manhattan to the other four districts. The percentages you report for 1800 and 2000 are accurate, and you note that the city’s population more than doubled between 1900 and 2000. However, the account is incomplete: it omits the key 1900 district figures, when Manhattan still held 54% and the other districts 46%, and gives no actual population totals to support the broad description of growth. The phrase “Manhattan was highest with 76%” also needs a clear time reference. Include selected figures across all three years and compare the rise in the other districts with Manhattan’s decline after 1900.
Coherence and Cohesion: Band 4.5
The response has a recognisable structure, with an introduction, an overview and separate paragraphs for the two tables. This helps the reader identify the topic and the broad trends. However, progression is limited because the body paragraphs repeat points already made in the overview: the 1800 and 2000 district percentages appear twice, while the 1900 comparison is absent. Some links are also unclear or mechanical. For example, “The first one” and “Second table” do not refer precisely to the tables, and “When we talk look at the districts” disrupts the flow. Organise the details chronologically or by table, use clear references, and make each paragraph add new information rather than restating earlier points.
Lexical Resource: Band 5.0
You use relevant vocabulary such as “total population,” “districts,” “increase,” and “dropped,” so the main subject and trends are generally understandable. However, the range is limited and several expressions are imprecise or unnatural for describing statistical data. “Numbers of total population” and “districts population” are awkward collocations; “huge increase” and “way too much” are informal or vague; and “made it to 81%” does not clearly describe a share. Repeated use of “total” and “population” also limits variety. Aim for precise reporting language, such as “the city’s population,” “accounted for,” and “rose to,” while keeping the wording formal and avoiding conversational emphasis.
Grammatical Range and Accuracy: Band 5.0
You attempt both simple and more complex sentence forms, including a contrast with “while” and a time clause beginning “After hundred years.” Most of the intended meaning can be understood, but some grammatical errors and incomplete constructions reduce accuracy. “As we can see huge increase” lacks a subject and article; “After hundred years it was more than double” has an incorrect article and an unclear reference for “it”; and “Manhattan was 76% of total people” uses an incomplete grammatical pattern. The opening “When we talk look at” also contains a faulty verb construction. Practise complete clauses, articles, and clear subjects, and check that comparisons specify what is increasing or changing.
See this exact question answered at other band scores. The same prompt compared across bands.
Browse more IELTS Writing model answers or get your own writing scored by the same AI examiner.