Band 5.0 IELTS Writing Task 1 Model Answer
Overall Band Score: 5.0 · Cambridge IELTS 20 · 2026-11-06
IELTS Writing Task 1 question
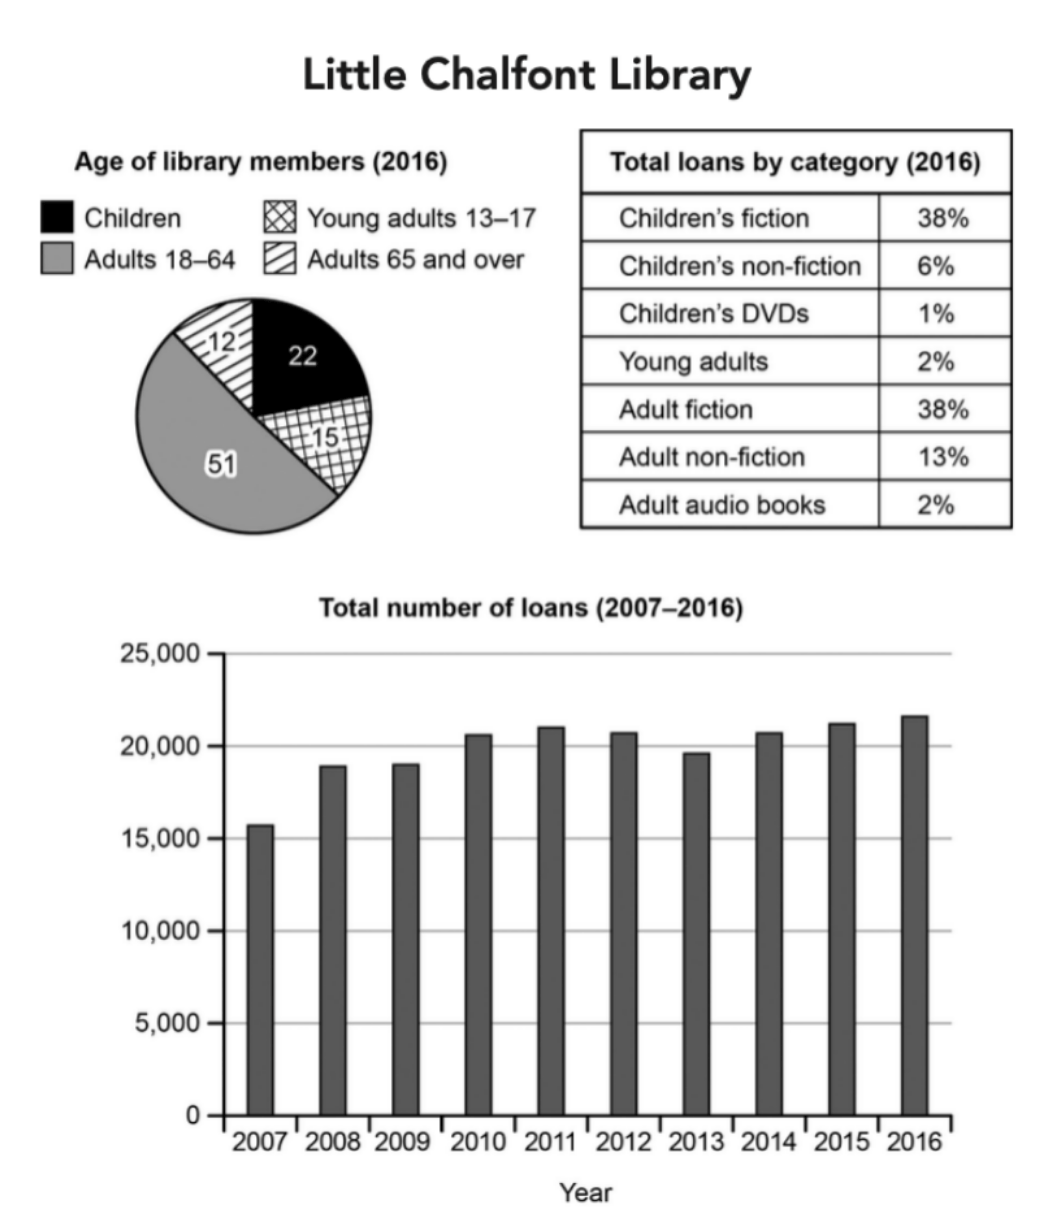
The charts below give information about a public library in a town called Little Chalfont.
Summarise the information by selecting and reporting the main features, and make comparisons where relevant.
Student answer (Band 5.0)
The three diffent graph illustrated the information about a local library in a town called Little Chalfont since 2007 to 2016.
Overall, the three graph discribed 3 different topics. The first one pie chart gives the information abaout this librrys members age groups. The table shares the overall loans by categories. However, the last bar chart illustrated the total numbers of loans.
Firstly the pie chart shares the librarys people age groups in 2016. In that time the largest age group is Adults 18-64 it was apromaxli 51%.Whereas the tiny share was the adults whos are over 65, but the notable part is 22% chlidren were joind the library.
Secondly, the table discribed the amount of categories books collections in 2016. The fiction books wew 38 percents whereas, children's DVDs only 1%. However, the non-fiction books were 13%.
AI examiner evaluation
| Criterion | Band |
|---|---|
| Task Achievement / Task Response | 3.5 |
| Coherence and Cohesion | 5.5 |
| Lexical Resource | 5.0 |
| Grammatical Range and Accuracy | 5.0 |
| Overall | 5.0 |
Task Achievement / Task Response: Band 3.5
You identify the three visual elements and include a basic overview, noting that the charts cover membership, loan categories and total loans. You also report some relevant figures, such as adults aged 18–64 at 51% and children’s DVDs at 1%. However, the response addresses the task only partially: the line chart’s decade-long trend is not described at all, and the category table is incomplete and partly misread. The 13% figure is for adult non-fiction, not non-fiction generally; the smallest membership group is adults aged 65 and over at 12%, while children account for 22%. The response also falls 12 words short of the required minimum. To improve, include a clear overview of the main patterns and compare the key figures across all three visuals.
Coherence and Cohesion: Band 5.5
The response has a recognisable structure: an introduction, an overview, and separate paragraphs beginning with “Firstly” and “Secondly.” These divisions help the reader see that you are discussing different visuals. However, progression is limited because the final chart is introduced but never discussed, and the overview mostly lists what each visual shows rather than summarising the main findings. Some linking is mechanical or unclear, as in “However” before the bar chart and “Whereas” introducing the smallest age group. Develop each paragraph around a main comparison, and use transitions that show the actual relationship between figures. A final paragraph on the loan trend would also make the organisation feel complete.
Lexical Resource: Band 5.0
You use some task-relevant vocabulary, including “age groups,” “overall loans,” “categories,” and “largest,” so the reader can generally identify the subject of each point. However, the range is limited and several spelling errors make the writing less clear, including “diffent,” “discribed,” “abaout,” and “apromaxli.” Some expressions are imprecise or unnatural: “librarys people age groups” and “the tiny share” do not describe the data accurately or naturally. Use standard chart language such as “proportion,” “accounted for,” and “loan categories,” and check spelling carefully. More precise labels would also help distinguish “adult non-fiction” from non-fiction overall.
Grammatical Range and Accuracy: Band 5.0
You attempt both simple sentences and some more complex forms, for example, “Whereas the tiny share was the adults…” and “The fiction books were 38 percents whereas…” However, the range is limited, and errors in sentence construction and punctuation are frequent enough to affect clarity. In “the largest age group is Adults 18-64 it was apromaxli 51%,” two clauses are joined without suitable punctuation or a connector. The phrase “the adults whos are over 65” also has an incorrect relative form, while “22% chlidren were joind the library” has an unclear grammatical relationship between the percentage and the people. Practise complete, well-punctuated comparisons, and check articles, clause boundaries, and consistent past-tense reporting.
See this exact question answered at other band scores. The same prompt compared across bands.
Browse more IELTS Writing model answers or get your own writing scored by the same AI examiner.