Band 5.5 IELTS Writing Task 1 Model Answer
Overall Band Score: 5.5 · Cambridge IELTS 20 · 2026-11-07
IELTS Writing Task 1 question
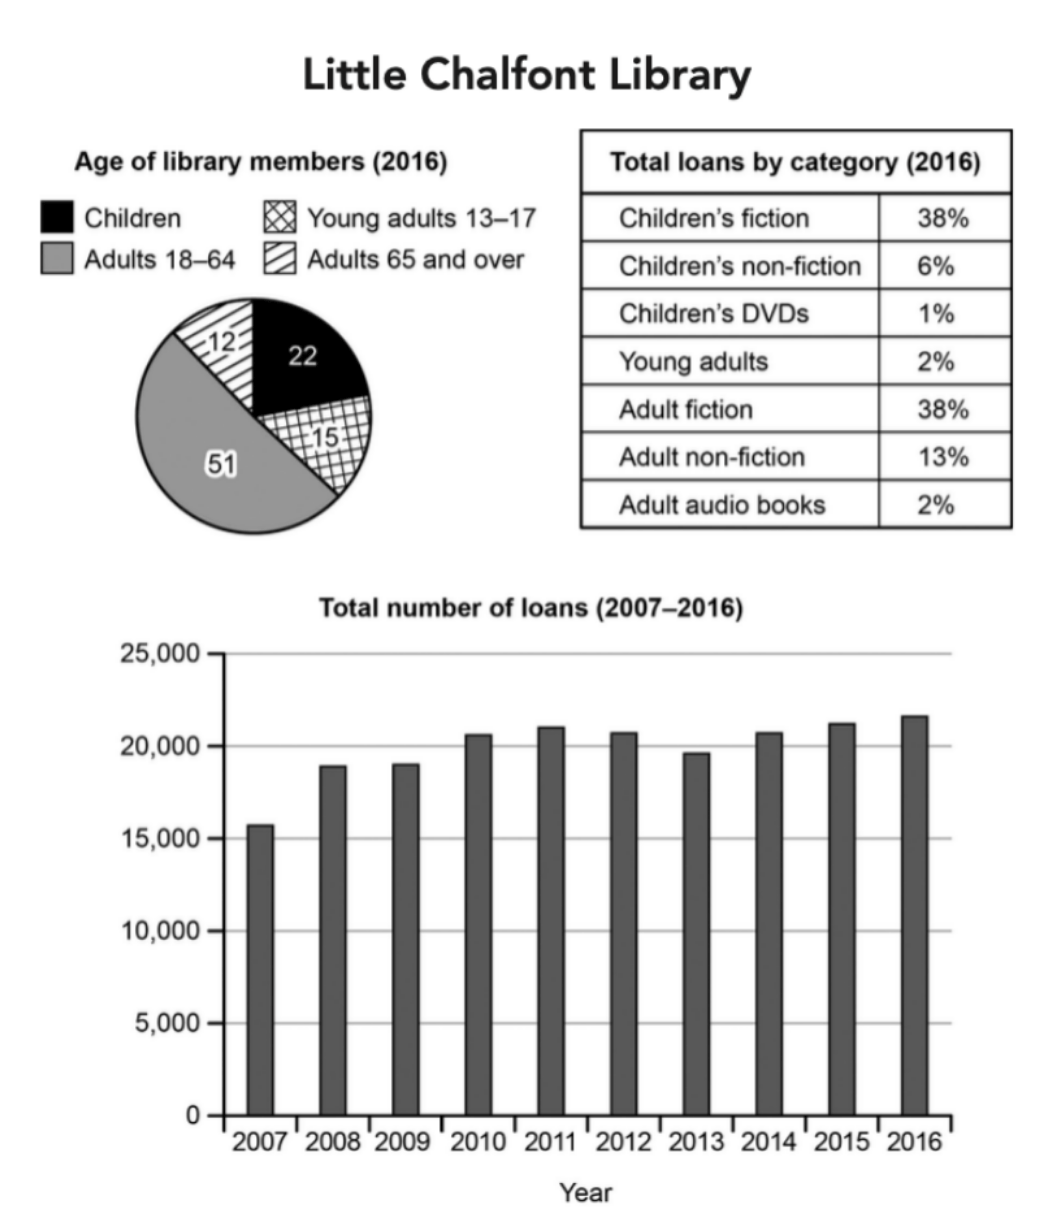
The charts below give information about a public library in a town called Little Chalfont.
Summarise the information by selecting and reporting the main features, and make comparisons where relevant.
Student answer (Band 5.5)
The charts illustrate some vital information about memebers of a public library in a liitle chalfont town in 2007 and 2016.
Overall, Most of them were 18 years old or above in 2016. Furthermore, The highent pecentage of loans was by Children fiction Category. in addition, Loans reached over 20000 in 2016 and before that, they were fuctuated.
Paticipants in library were in diffierent age as 15% of them were between 13-17 years old. and 12% were Adults over 65 years old. Children were 22% of the total members. Otherwise, people betweem 18-64 were the most.
Kids were not the highest percentage nevertheless 36% of loans were children fiction and that was the larget porprotion of total loans by ctaegory in 2016, and the lowest were Adult audio books by only 2%.
During [redacted phone], The number of them differd.
In the fisrt 3 years, The numer was not above 20000. but it icreased to 20000 in 2010, 2011 and 2012.
After that, It fell to less then twenty thousand. But it continued to rise in 2014 and 2015 to reach the peak in 2016
AI examiner evaluation
| Criterion | Band |
|---|---|
| Task Achievement / Task Response | 5.5 |
| Coherence and Cohesion | 5.5 |
| Lexical Resource | 5.0 |
| Grammatical Range and Accuracy | 5.0 |
| Overall | 5.5 |
Task Achievement / Task Response: Band 5.5
You identify the main groups and trends, including the dominance of adults aged 18–64 among members and the rise in total loans by 2016. However, several details are inaccurate or unclear: children’s fiction accounted for 38% of loans, not 36%, and it tied with adult fiction rather than being uniquely the largest category. The lowest share was children’s DVDs at 1%, not adult audio books at 2%. The overview also says loans “reached over 20000 in 2016,” but the chart shows a gradual rise to about 21,700, with fluctuations in between. To make the report more complete and precise, compare the two leading loan categories and describe the overall loan trend with accurate figures.
Coherence and Cohesion: Band 5.5
The response has a recognisable structure: an overview followed by paragraphs on membership, loan categories and the time series. This helps the reader identify the different charts. However, progression within paragraphs is sometimes unclear, and several linking expressions are used mechanically or inaccurately. For example, “Otherwise” does not clearly introduce the largest membership group, while “nevertheless” creates an unclear contrast between children’s membership share and their loan share. The final paragraph repeats the idea of change without clearly distinguishing the early rise, subsequent dip and later recovery. Use clearer topic sentences and connect comparisons directly, so each paragraph develops one chart’s main features in a logical order.
Lexical Resource: Band 5.0
You use some relevant vocabulary for describing charts, including “percentage,” “total members,” “loans,” “increased,” “fell” and “peak.” This gives the response a basic range suited to the task. However, spelling errors are frequent, including “memebers,” “fuctuated,” “porprotion” and “ctaegory,” and several choices are imprecise or unnatural, such as “participants in library” and “the number of them.” These errors sometimes make the intended meaning harder to follow. Build accuracy by checking spelling and using standard chart language consistently, for example “library members,” “loan figures” and “share of total loans.” Avoid informal terms such as “kids” in an academic report.
Grammatical Range and Accuracy: Band 5.0
You attempt both simple and more complex sentences, including “Although”/contrast-style constructions and time clauses, and the reader can generally understand the main message. However, grammatical errors occur frequently and sometimes make relationships between ideas unclear. Examples include “Most of them were 18 years old or above,” where the age group is expressed imprecisely, and “Children were 22% of the total members,” which needs a more accurate grammatical construction. Sentence boundaries and punctuation are also inconsistent, with capital letters after full stops used irregularly and some clauses joined awkwardly, as in “After that, It fell… But it continued…”. Practise accurate comparisons and past-tense reporting, and proofread articles, sentence boundaries and punctuation.
See this exact question answered at other band scores. The same prompt compared across bands.
Browse more IELTS Writing model answers or get your own writing scored by the same AI examiner.