Band 6.0 IELTS Writing Task 1 Model Answer
Overall Band Score: 6.0 · Cambridge IELTS 20 · 2026-11-07
IELTS Writing Task 1 question
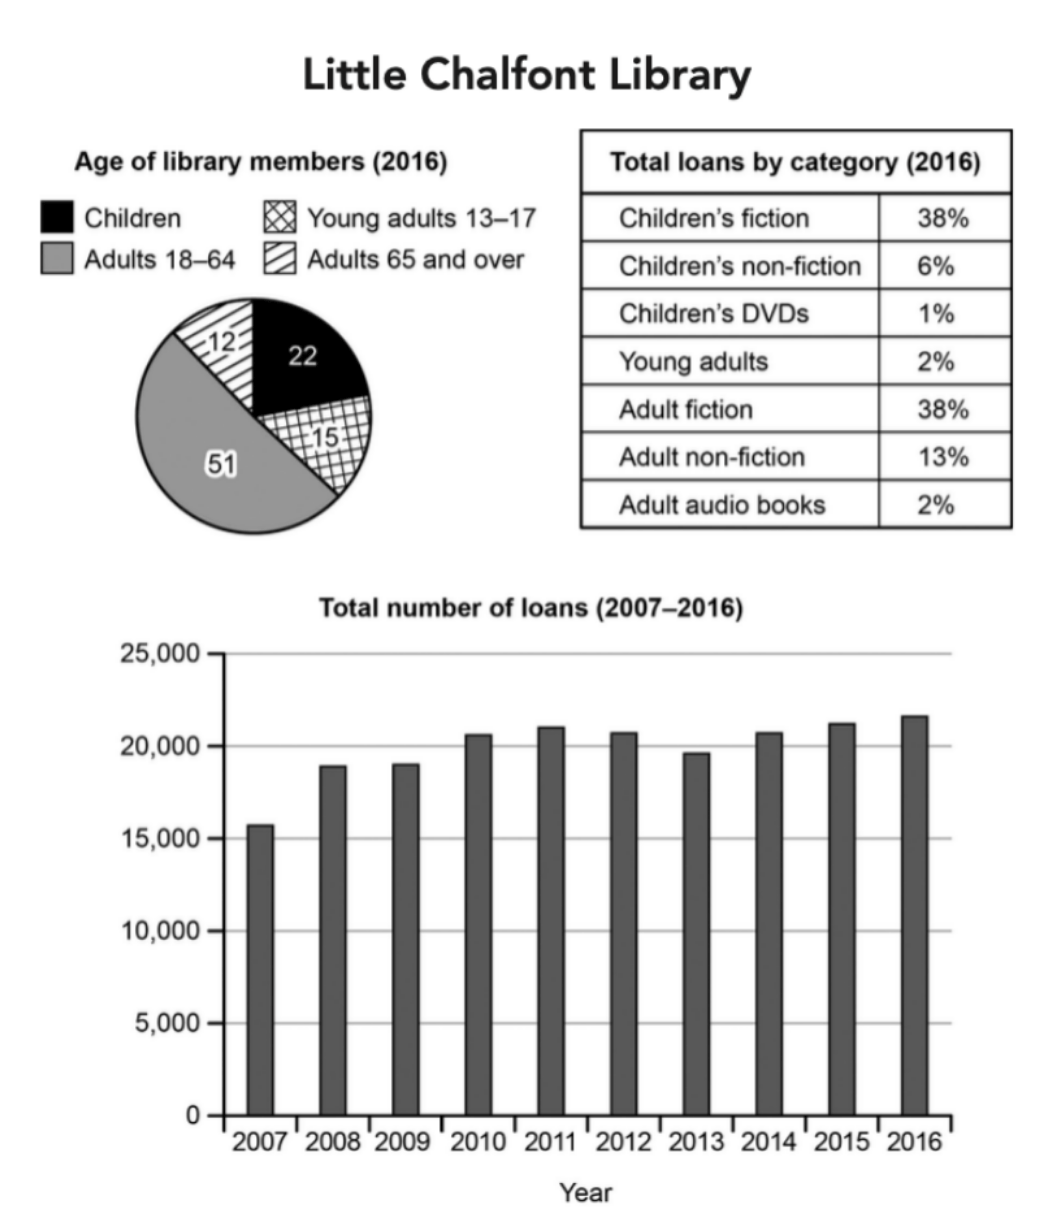
The charts below give information about a public library in a town called Little Chalfont.
Summarise the information by selecting and reporting the main features, and make comparisons where relevant.
Student answer (Band 6.0)
The charts illustate the three important features of Little Chalton Library, pie chart showing library members of different age groups, table showing the total loans by category in 2016 and the graph shows the total number of loans between the years 2007 and 2016.
The pie chart clearly shows that highest number of members fall in the age group of adult 18-64 , children at the second number, young adults 13-17 at third number and finllay adults 65 and over on fourth number.
The table represents the total number of loans in the year 2016 based on the different categories of books. It shows that children fiction and adult fiction books had the highest popularity with 38% of the total loans. Adult non-fiction comes next in the line and is 13% whereas children's non-fiction is only 6%. The categories like young adults and adult audio books are only of little attention with 2% only. The least are children's DVDs only 1%.
Finally the graph shows the total number of loans from 2007 till 2016. The data shows that 2016 is the year with maximum number of loans that is around 22,000 books being boroughed from the library. The pattern in the graph clearly pictures that with the ongoing years the number of loans had increased with an exception in the year 2013 where it is a prominent decline and again the next year it crossed 20,000 books.
AI examiner evaluation
| Criterion | Band |
|---|---|
| Task Achievement / Task Response | 6.0 |
| Coherence and Cohesion | 6.5 |
| Lexical Resource | 6.0 |
| Grammatical Range and Accuracy | 5.5 |
| Overall | 6.0 |
Task Achievement / Task Response: Band 6.0
You cover all three visuals and identify several important features accurately: adults aged 18–64 are the largest membership group, fiction accounts for the largest loan shares, and loans reach their highest level in 2016. The category percentages are reported correctly, and the description of the overall rise with a dip around 2013 is broadly supported. However, the age-group comparison is only ranked, without the figures that would make the differences clear. The trend is also somewhat generalised: loans did not rise steadily, and the decline began after 2011 before the later recovery. Include a concise overview of the main patterns and support it with selected figures, such as the starting total and the 2013 low point, to make coverage more complete and precise.
Coherence and Cohesion: Band 6.5
The response is arranged in a clear sequence: an introduction identifies the visuals, followed by separate discussion of membership, loan categories and the time series. Transitions such as “The table represents” and “Finally” help readers follow the shift between charts, and the information is generally easy to understand. This coherent organisation meets the lower-band expectations and shows some stronger control through clear paragraph-level progression. However, the repeated formula of naming each visual and then listing details makes the report feel somewhat mechanical. The final paragraph would be more cohesive if it connected the overall trend to its key stages, rather than moving from the 2016 peak to a general statement about an exception. Use more varied linking and clearer comparisons between related figures.
Lexical Resource: Band 6.0
You use an adequate range of task-related vocabulary, including “categories,” “popularity,” “decline,” and “maximum number,” so the main information is communicated. There are also attempts at more descriptive phrasing, such as “prominent decline.” However, several word choices and collocations are unnatural or imprecise: “highest number of members fall,” “at the second number,” and “little attention” do not express the comparisons naturally. Spelling errors such as “illustate,” “Chalton,” “finllay,” and “boroughed” also reduce accuracy. Aim for standard chart language such as “accounted for,” “ranked second,” and “the lowest share,” and check spelling carefully. This would make the vocabulary more precise without requiring unnecessarily complex wording.
Grammatical Range and Accuracy: Band 5.5
You attempt both simple and more complex sentence forms, including clauses introduced by “where” and “that,” and most of the intended meaning remains clear. Some sentences are grammatically controlled, for example, “The least are children’s DVDs only 1%,” though this construction is not fully natural. Other sentences contain errors in agreement, articles, or sentence structure: “highest number of members fall” needs a clearer subject and verb pattern, while “children fiction and adult fiction books had the highest popularity” has an awkward grammatical construction. Punctuation and spacing around commas are also inconsistent. Work on accurate comparative structures and complete, well-punctuated sentences; for example, “Adults aged 18–64 made up the largest group, at 51%.”
See this exact question answered at other band scores. The same prompt compared across bands.
Browse more IELTS Writing model answers or get your own writing scored by the same AI examiner.