Band 4.5 IELTS Writing Task 1 Model Answer
Overall Band Score: 4.5 · Cambridge IELTS 20 · 2026-11-07
IELTS Writing Task 1 question
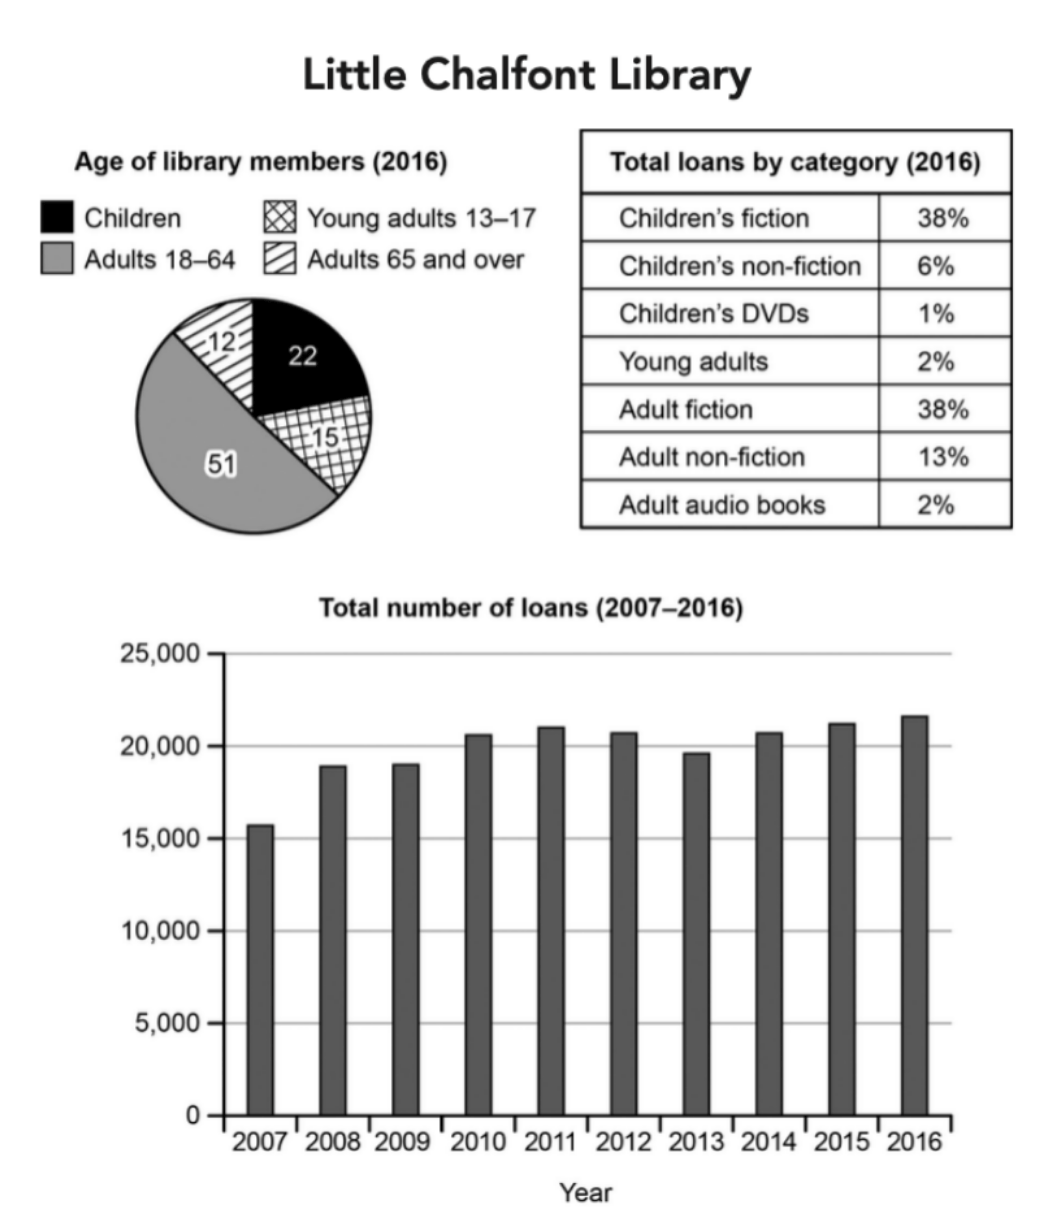
The charts below give information about a public library in a town called Little Chalfont.
Summarise the information by selecting and reporting the main features, and make comparisons where relevant.
Student answer (Band 4.5)
in 2016 more than half of library members were adult are 18_64 age at 51 percent the second largest group were adult aged as64 And over at21percentage and the third gere children and young age aroun14_17at15 percent and the ladt group is childre age as12 around Fifteen percentage at only twelve percentagethe table the the loans of youngs and adult both are fiction and highes loan in 2016 at58 adult non fiction was 13 and young non fiction was 12 children are low at2 the bargraph show the total loan of 2007to 2016 there were at 15000 and increases21000 at 2016 in every year it increases total period of loan over the time from 2007 to 2016
AI examiner evaluation
| Criterion | Band |
|---|---|
| Task Achievement / Task Response | 4.5 |
| Coherence and Cohesion | 4.5 |
| Lexical Resource | 5.0 |
| Grammatical Range and Accuracy | 4.5 |
| Overall | 4.5 |
Task Achievement / Task Response: Band 4.5
You identify relevant features, including the largest membership group (adults aged 18–64, at 51%) and the two leading loan categories (adult and children’s fiction, each 38%). You also attempt to describe the decade-long loan trend. However, several figures are misreported: the 65-and-over group is 12%, not 21%; children account for 22%, not 12%; and the category figures are confused, including “young non fiction was 12” when young adults’ loans are 2%. The trend is broadly upward, but it is not an increase every year: loans fall after 2011 and again in 2013. The response is also 33 words below the required minimum, limiting coverage and detail. Include an accurate overview and select key comparisons.
Coherence and Cohesion: Band 4.5
The response contains information about all three visuals, and its broad sequence—from membership to loan categories and then the time series—gives the reader some sense of organisation. However, it is presented as one continuous, difficult-to-follow passage, with no clear paragraphing or distinct overview. Connections between ideas are often unclear, as in “the table the the loans of youngs and adult both are fiction,” and the final trend statement repeats the idea of increases without explaining the fluctuations. Use separate paragraphs for the overview and supporting details, and organise each section around a clear comparison. Basic linking and reference need to make relationships between figures easier to follow.
Lexical Resource: Band 5.0
You use some task-relevant vocabulary, including “library members,” “fiction,” “non fiction,” “bargraph,” and “total loan,” so the reader can recognise the subject of each visual. However, the range is limited and several choices or forms are inaccurate or unclear, such as “the ladt group,” “loans of youngs,” and “highes loan.” Repetition of “loan” and “group” also makes the account less precise. Spelling and word formation errors, including “gere” and “childre,” sometimes slow understanding. Build a reliable set of chart terms—such as “proportion,” “category,” “accounted for,” and “rose”—and check spelling and collocations. More precise vocabulary would help distinguish membership shares from loan shares.
Grammatical Range and Accuracy: Band 4.5
You attempt to report figures and make comparisons, but sentence structures are mostly simple or run together, and frequent errors make relationships difficult to interpret. For example, “more than half of library members were adult are 18_64 age at 51 percent” has problems with agreement, sentence structure, and the way the age range is expressed. The passage also lacks clear sentence boundaries and punctuation, while phrases such as “the second largest group were adult aged” show inconsistent agreement and incomplete grammatical patterns. Practise writing complete sentences with a clear subject and verb, then use accurate past-tense forms to describe the 2016 data and the historical trend. A few controlled complex sentences can add variety without sacrificing clarity.
See this exact question answered at other band scores. The same prompt compared across bands.
Browse more IELTS Writing model answers or get your own writing scored by the same AI examiner.