Band 6.0 IELTS Writing Task 1 Model Answer
Overall Band Score: 6.0 · Cambridge IELTS 20 · 2026-11-08
IELTS Writing Task 1 question
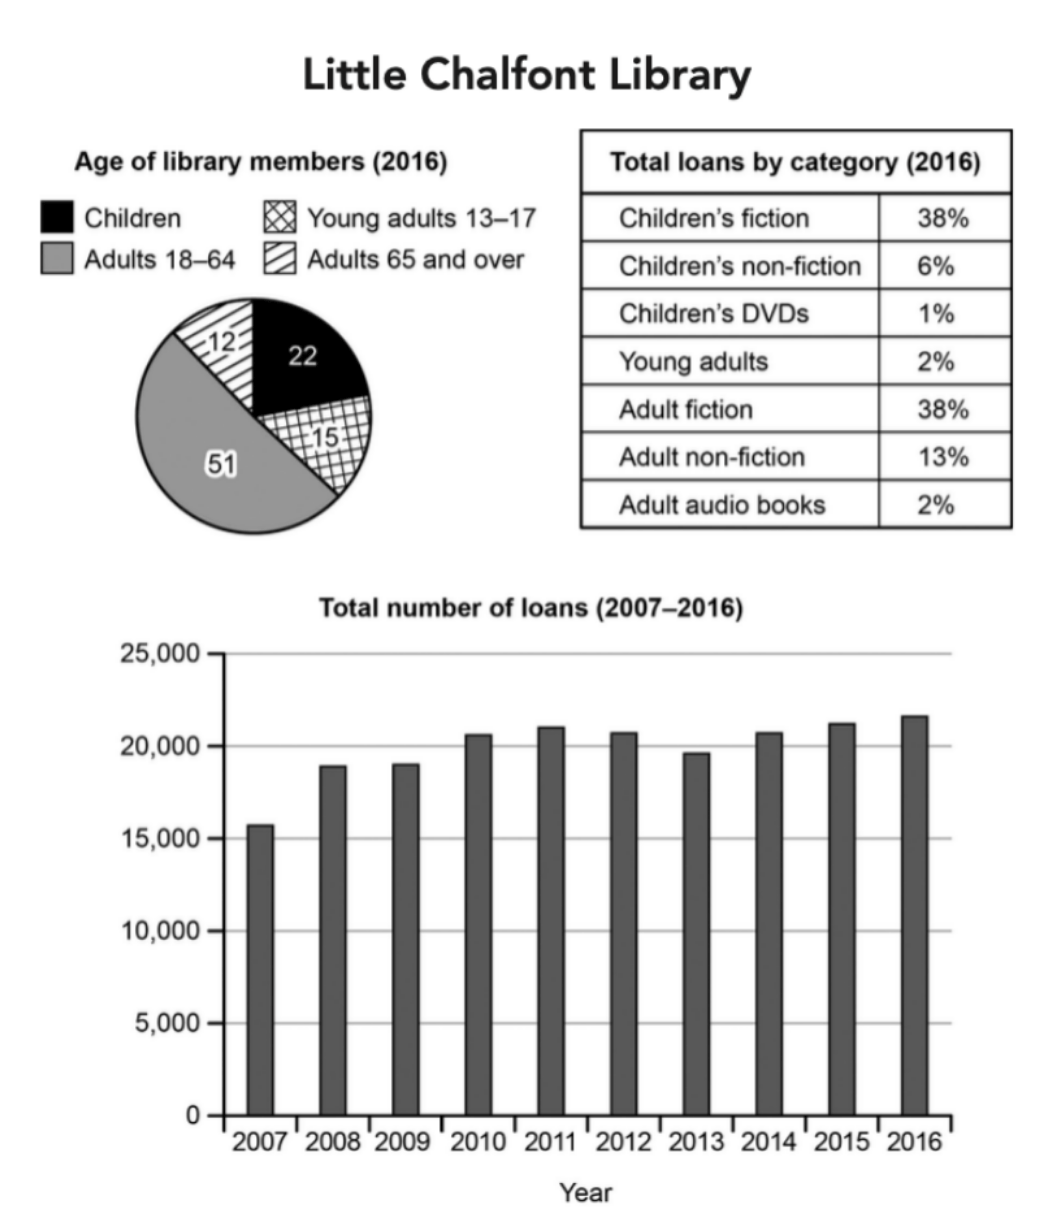
The charts below give information about a public library in a town called Little Chalfont.
Summarise the information by selecting and reporting the main features, and make comparisons where relevant.
Student answer (Band 6.0)
The pie chart, bar chart and table illustrate the data of a public library in a town known as Little Chalfont.
Overall, pie chart shows the information about the age of library participants, table demonstrates the data of the total loan and bar chart has information of the total numbers of loans in mentioned years.
In pie chart, Children, Young adults and Adults contribute 22%, 15% and 51% accordingly. Children's non fiction and adult non fiction made only 6% and 13% of the total loans in 2016. Futhermore, Adults having 65 and above ages contributes only 12% in library.
In table, Adult fiction and Children's fiction have 38% loans. Conversely, Children's DVD and young adults made only 1% and 2% loans respectively. Bar chart illustrates the total number of loans from 2007 to 2016. In 2007, total number of loans are about 16,000. Additionally, loan increases at 21,000 in 2012 and fluctuate over all the following years and about 22,000 in 2016.
AI examiner evaluation
| Criterion | Band |
|---|---|
| Task Achievement / Task Response | 5.5 |
| Coherence and Cohesion | 6.0 |
| Lexical Resource | 6.0 |
| Grammatical Range and Accuracy | 5.5 |
| Overall | 6.0 |
Task Achievement / Task Response: Band 5.5
You identify the three visuals and report several relevant figures, including the 51% share of adults aged 18–64, the equal 38% shares for adult and children’s fiction, and the overall rise in loans from about 16,000 to 22,000. However, the overview mainly describes what each visual contains rather than summarising the main findings. The loan trend is also misreported: loans reached about 21,000 in 2011, not 2012, and the response does not clearly describe the subsequent fluctuations or the overall pattern. The age figures are incomplete because the 12% group is mentioned without identifying it clearly as adults aged 65 and over. Select the key comparisons and state the trend accurately to make the summary more complete.
Coherence and Cohesion: Band 6.0
The response has a recognisable structure: an introduction, an overview, and paragraphs covering the age and loan information. This gives the reader a basic route through the visuals, and linking words such as “Overall,” “Furthermore,” and “Conversely” help connect points. However, the overview is not an effective summary of the main trends, and the body moves between age-group data and loan-category data without a clear organising principle. Some references are also unclear: “In pie chart” and “In table” do not consistently identify which figures are being discussed, while “the following years” leaves the trend imprecise. Grouping the age profile and loan categories separately, then describing the time series in sequence, would improve progression and cohesion.
Lexical Resource: Band 6.0
You use an adequate range of task-related vocabulary, including “contribute,” “total loans,” “fiction,” “non-fiction,” and “fluctuate.” These terms make the subject understandable, and you attempt to vary how figures are described. However, several choices are imprecise or unnatural, such as “library participants” for members, “made only” for loan shares, and “the data of” when introducing the visuals. There are also spelling and form errors, including “Futhermore” and “non fiction.” Use standard chart-reporting collocations and check spelling and category labels carefully. More precise language for proportions and trends would make the comparisons clearer without requiring unnecessarily complex vocabulary.
Grammatical Range and Accuracy: Band 5.5
You use both simple statements and some more developed structures, such as “Children’s non fiction and adult non fiction made only 6% and 13% of the total loans in 2016.” The main information is generally understandable, but some grammatical errors remain. For example, “Overall, pie chart shows” is missing an article, and “Adults having 65 and above ages contributes” has an incorrect verb form and agreement. In “In 2007, total number of loans are about 16,000,” the tense and article use are also inaccurate. The response relies heavily on short, similarly structured sentences. Practise accurate articles, subject–verb agreement, and past-tense reporting, while adding a few controlled complex sentences to compare categories and describe changes.
See this exact question answered at other band scores. The same prompt compared across bands.
Browse more IELTS Writing model answers or get your own writing scored by the same AI examiner.