Band 6.5 IELTS Writing Task 1 Model Answer
Overall Band Score: 6.5 · Cambridge IELTS 20 · 2026-11-09
IELTS Writing Task 1 question
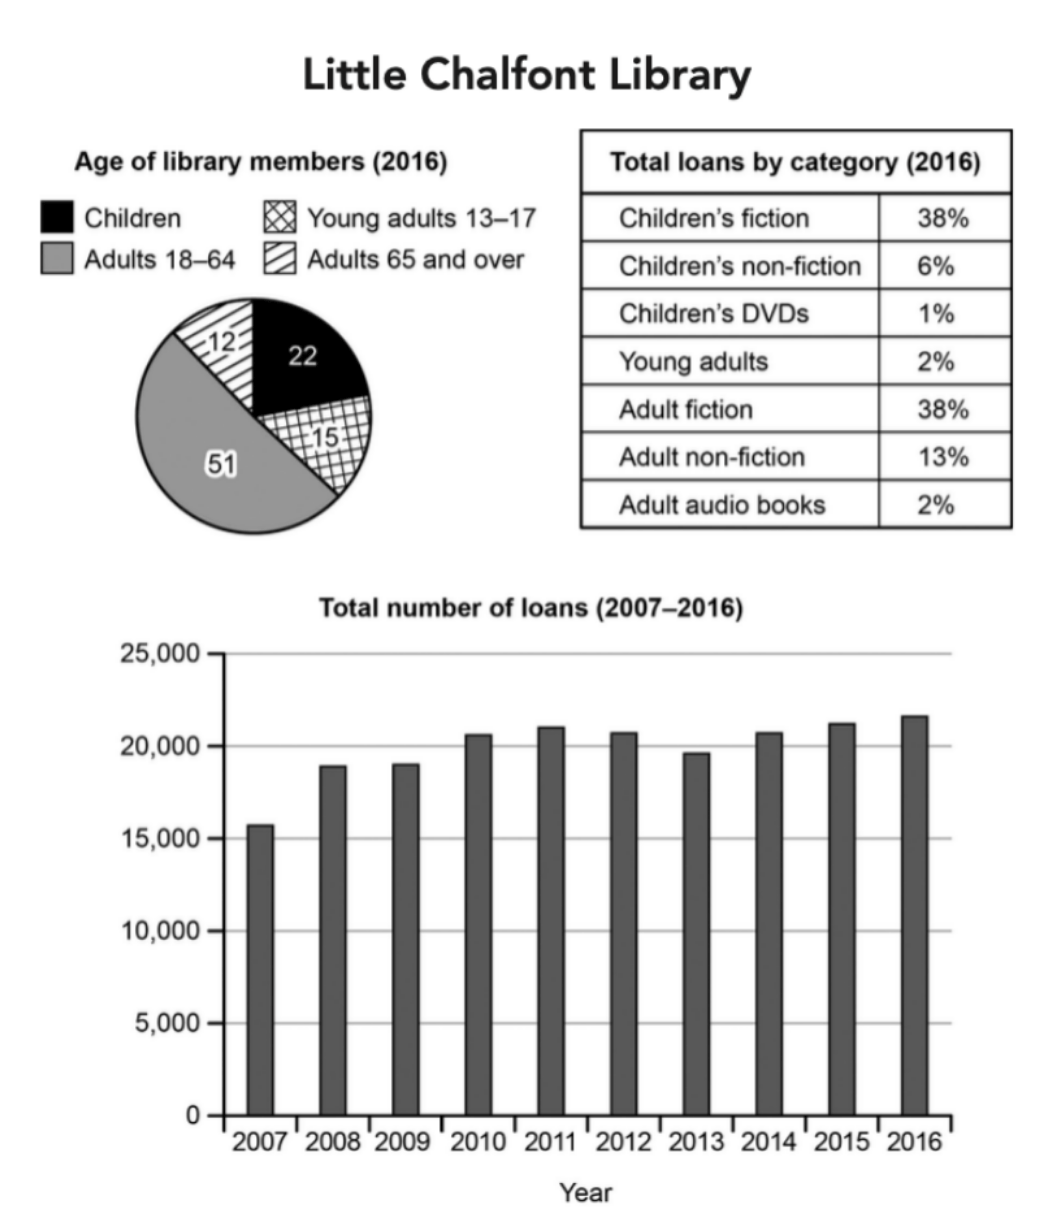
The charts below give information about a public library in a town called Little Chalfont.
Summarise the information by selecting and reporting the main features, and make comparisons where relevant.
Student answer (Band 6.5)
The pie chart, table and bar graph illustrate the information about a public library in a Little Chalfont town.
Overall, it can be seen that the pie chart shows highest proportion of libarary members belong to adults 18-64 age group. The table demonstrates that the major category of loan was children's fiction and adult fiction. While bar graph illustrates highest number of loans were taken in 2016 and least in 2007.
In 2016, around half of the library members were adults of age 18-64 and possess 51%, less than quater(22%) library members were children. Adults members over 65 age were 12% and 15% members were young adults age of 13-17.
The table illustrates that highest percentage of loan category in 2016 were children's fiction and adult fiction each 38%. Adult non-fiction was 13% and 6% of the loans taken in children's non-fiction. Under 6% categories were adult audio books, young adults and children;s DVDs.
The bar graph demonstrate that in 2007 the total number of loans lend were just above 15000, which increased to around 18000 in 2008 and remained same in 2009 with about 18000. In 2010, number of loan rose to nearly 21000 and stayed more or less same untill 2012, and decreased to approximately 19000 in 2013. A little surged seen again in 2014 and reached nearly 21000, then gentle increased was in both years 2015 and 2016 with 22000 in 2015 and [redacted phone].
AI examiner evaluation
| Criterion | Band |
|---|---|
| Task Achievement / Task Response | 7.0 |
| Coherence and Cohesion | 7.0 |
| Lexical Resource | 6.0 |
| Grammatical Range and Accuracy | 5.5 |
| Overall | 6.5 |
Task Achievement / Task Response: Band 7.0
You cover all three visuals and provide a clear overview: adults aged 18–64 form the largest membership group, fiction dominates loans, and total borrowing is highest at the end of the period and lowest at the start. Most figures are reported accurately, including the 51% adult membership share and the two 38% fiction categories. The trend description also captures the rise, mid-period fluctuations and later increase. A few details are less precise: the 2016 total is closer to 21,700 than 23,000, and the 2015 figure is about 21,200 rather than 22,000. The overview could also identify the overall rise more explicitly. More precise reporting of the final values would strengthen an otherwise well-covered response.
Coherence and Cohesion: Band 7.0
The response is organised effectively into an introduction, an overview and separate paragraphs for the membership, loan categories and borrowing trend. This gives the reader a clear progression through the three visuals, and linking expressions such as “Overall,” “In 2010” and “then” help signal relationships and chronology. The overview also brings together the main features rather than simply listing data. Some connections are less smooth, however: “While bar graph illustrates” is an incomplete contrast, and the repeated use of “The table illustrates” and “The bar graph demonstrate” makes the reporting somewhat formulaic. Improve the flow by varying how you introduce comparisons and by linking related figures within sentences, while retaining this clear paragraph structure.
Lexical Resource: Band 6.0
You use an adequate range of vocabulary for describing charts, including “proportion,” “category,” “increased,” “decreased” and “remained.” These choices generally communicate the data, and terms such as “approximately” and “more or less” help express estimates. However, several word choices and collocations are inaccurate or awkward: “possess 51%” is not natural for a share, “loans lend” confuses the noun and verb, and “a little surged” is not an appropriate description of a small rise. Spelling errors such as “libarary,” “quater” and “untill” also reduce control. Aim for precise chart language, for example “accounted for,” “the number of loans borrowed,” and “rose slightly,” and check spelling carefully.
Grammatical Range and Accuracy: Band 5.5
You attempt a mix of simple and more complex sentences, including the overview sentence beginning “While bar graph illustrates” and the chronological account of changes. The meaning is usually recoverable, but some grammatical errors recur. For example, “the major category of loan was” does not agree naturally with the two categories described, and “The bar graph demonstrate” has a subject–verb agreement error. Articles and sentence construction also need attention in “in a Little Chalfont town” and “While bar graph illustrates,” while the final trend sentence joins several changes without clear grammatical control. Practise accurate agreement, articles and complete clauses, then use shorter sentences when reporting several figures. Greater consistency in these areas would make your varied sentence attempts more reliable.
See this exact question answered at other band scores. The same prompt compared across bands.
Browse more IELTS Writing model answers or get your own writing scored by the same AI examiner.