Band 6.0 IELTS Writing Task 1 Model Answer
Overall Band Score: 6.0 · Cambridge IELTS 20 · 2026-11-09
IELTS Writing Task 1 question
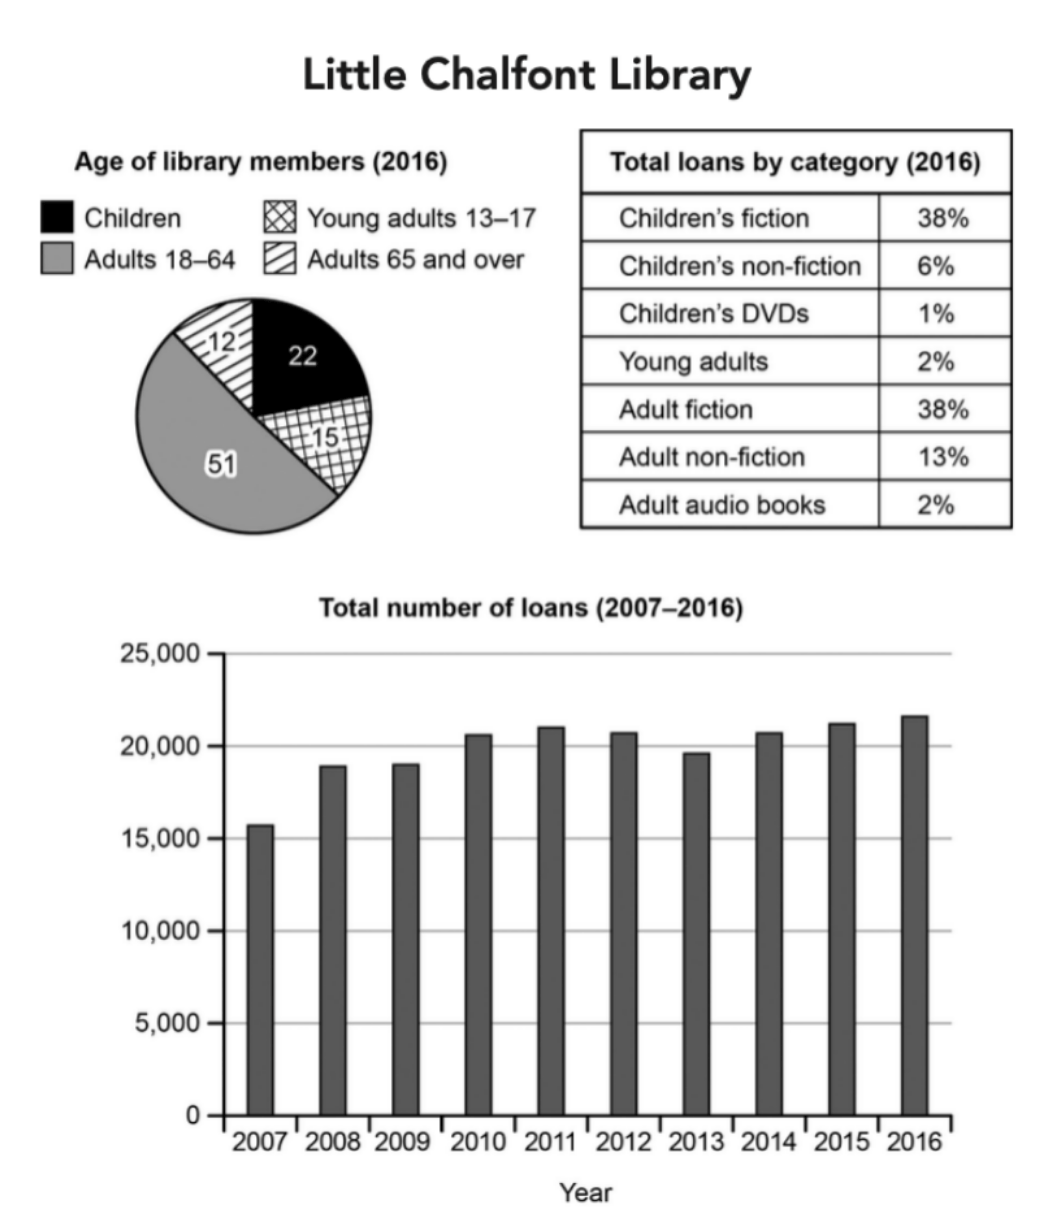
The charts below give information about a public library in a town called Little Chalfont.
Summarise the information by selecting and reporting the main features, and make comparisons where relevant.
Student answer (Band 6.0)
The following pie chart,table and bar graph illustrate the information about a public library in a city and it is also known as little chalfont.
Overall,in pie chart in 2016 the number of adults was maximum,while figure of adults age of 65 and over was minimum.In table loans of children's fiction was maximum ratio while children's DVDs had minmum ration.In bar graph number of loans maximum in 2016 on the otherhand in 2007 ratio of loans was minmum.
Generally,in pie chart ratio of adults was maximum with the number of 51%,while only 12 % of adults 65 and over.Children only 22% and young adults only 15%.
In table, category of children's fiction 38%,children's non-fiction only 6 %,children's DVDs only 1%,young adults only 2%,adult fiction 38%,adult non-fiction 13% and adult audio books only 2%.
Moreover,in bar graph number of loans was minimum in 2007 with the amount of approximately 16000,while in 2016 number of loan was maximu m with the amount of round about 23000.From 2007 to 2016 total amount fluctuated but in 2016 amount at its on peak.
AI examiner evaluation
| Criterion | Band |
|---|---|
| Task Achievement / Task Response | 6.5 |
| Coherence and Cohesion | 6.0 |
| Lexical Resource | 5.5 |
| Grammatical Range and Accuracy | 5.0 |
| Overall | 6.0 |
Task Achievement / Task Response: Band 6.5
You cover all three visuals and identify several important features: adults aged 18–64 form the largest membership group, children’s and adult fiction each account for the largest loan share, and loans reach their highest level in 2016. Most figures are accurately reported. The overview is relevant, but the claim that 2007 was the minimum is not quite precise: the chart shows about 15,700, so “approximately 16,000” is suitable, while 2016 is about 21,700 rather than 23,000. You also say the total fluctuated without describing its rise to 2011, subsequent dip, and recovery. This addresses the task well, with some features more fully reported than others; a more precise trend summary would strengthen it further.
Coherence and Cohesion: Band 6.0
The response has a clear overall structure: an introduction, an overview, and separate descriptions of the membership and loan data. This makes the information easy to locate. However, the progression within the final paragraph is limited: it gives the endpoints and then says the total “fluctuated,” without guiding the reader through the main stages of change. Some linking is mechanical, particularly the repeated use of “while,” “only,” and “Moreover.” The opening sentence also combines the chart types and library name awkwardly, and punctuation spacing makes some sections run together. Grouping related figures more deliberately and using a few precise transitions would make the organisation smoother and cohesion less repetitive.
Lexical Resource: Band 5.5
You use relevant task vocabulary, including “loans,” “category,” “fiction,” “non-fiction,” and “fluctuated,” so the main information is generally understandable. However, several word choices and collocations are inaccurate or repetitive: “maximum ratio,” “minimum ration,” and “number of loan” are not natural ways to describe these data. “Ratio” is also used where “percentage” or “share” is intended. Spelling errors such as “minmum” and “maximu” reduce accuracy, while repeated “only” adds little meaning. Aim for a more precise range of chart language, such as “accounted for,” “proportion,” “peaked,” and “fell,” and check spelling and word forms carefully.
Grammatical Range and Accuracy: Band 5.0
You attempt some complex comparisons, for example, “the number of adults was maximum, while figure of adults age of 65 and over was minimum,” and the overall meaning can usually be followed. However, sentence structures are limited and several attempts are not grammatically controlled. Articles and noun phrases are missing or awkward (“while figure,” “adults age of 65 and over”), and the final sentence, “in 2016 amount at its on peak,” lacks a correctly formed verb phrase. Commas are often followed by no space, and the opening sentence joins ideas without clear grammatical structure. Practise complete subject–verb sentences and accurate comparative forms, such as “the proportion of adults was highest, whereas the over-65 group was smallest.”
See this exact question answered at other band scores. The same prompt compared across bands.
Browse more IELTS Writing model answers or get your own writing scored by the same AI examiner.