Band 5.0 IELTS Writing Task 1 Model Answer
Overall Band Score: 5.0 · Cambridge IELTS 20 · 2026-11-09
IELTS Writing Task 1 question
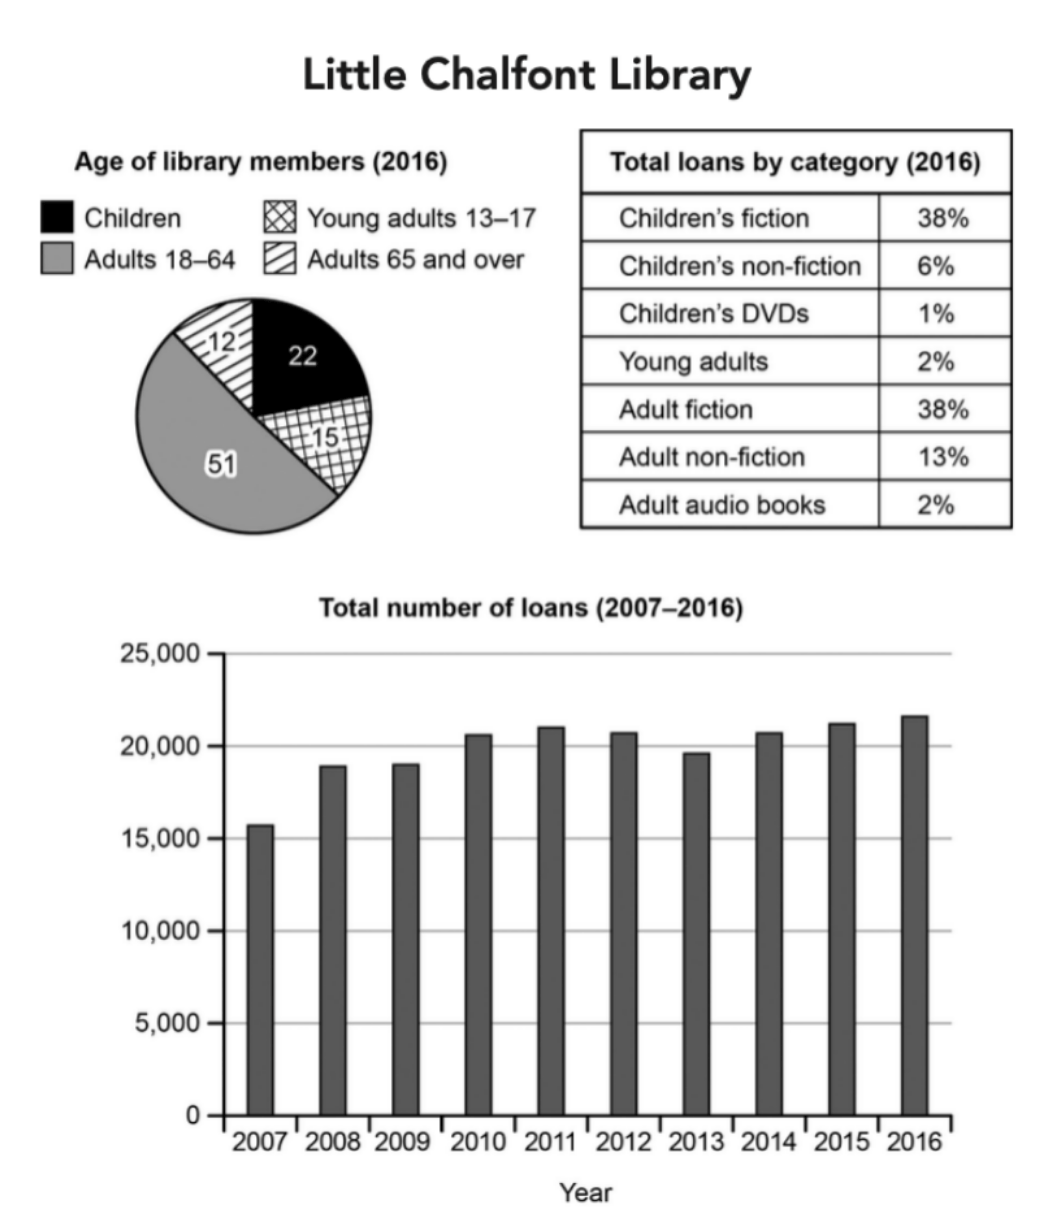
The charts below give information about a public library in a town called Little Chalfont.
Summarise the information by selecting and reporting the main features, and make comparisons where relevant.
Student answer (Band 5.0)
"The pie chart illustrates differet litlle chalfont Library according to different categories.
In 2016 the books of children's fiction were 38%.While children's non-fiction were
6%.And the books of children's DVDs were 1%.Morever Young adults books were 2%.
The books of adult fiction were 38%.
The adult non-fiction books were 13%.However the audio books were 2%.Overall,the books
of children fiction books were highest.And the children's DVDS were Lowest.
Secondly,The bar chart illustrates the total number of loans in different years.
The number of loans was 15,000 in 2007. Moreover, the number of loans was 18,000 in 2008
and was 19,000 in 2009.
However, the number of loans was 20,000 in 2010 and was 21,000 in 2011. The number of
loans was 22,000 in 2012, while the number of loans was 19,000 in 2013.
In 2014, the number of loans increased to 20,000. In 2015, the number of loans was 21,000.
Finally, the number of loans was 22,000 in 2016. The lowest figure was 15,000."
AI examiner evaluation
| Criterion | Band |
|---|---|
| Task Achievement / Task Response | 5.0 |
| Coherence and Cohesion | 5.5 |
| Lexical Resource | 5.0 |
| Grammatical Range and Accuracy | 5.0 |
| Overall | 5.0 |
Task Achievement / Task Response: Band 5.0
You report several relevant figures from the two charts, including the 38% shares for children’s and adult fiction and the rise in loans from 2007 to 2016. However, the response only partially covers the visual information: it omits the age profile of library members, and the overview focuses on the highest and lowest loan categories rather than summarising the main patterns across all three visuals. Some loan figures are inaccurate: for example, 2012 is about 20,700, not 22,000, and 2016 is about 21,700, not 22,000; the 2007 figure is also approximately 15,700. To improve, include a concise overview comparing the main features and report the key figures more accurately.
Coherence and Cohesion: Band 5.5
The response is divided into sections for the pie chart and the loan chart, so the reader can generally identify which information is being described. However, progression within these sections is limited: the pie-chart figures are listed one by one, and the loan figures are presented as a year-by-year sequence without grouping the overall rise, fluctuations, or ending level. Connectors such as “Moreover,” “However,” and “Finally” are repeated or do not show a clear contrast. The opening also does not establish a clear plan for covering all the visuals. Organise the response into an introduction, an overview, and focused detail paragraphs, grouping related figures and using linking words only where their meaning fits.
Lexical Resource: Band 5.0
You use relevant chart vocabulary such as “percentage,” “number of loans,” “increased,” and “lowest,” which helps communicate the basic information. However, the range is limited and several phrases are awkward or imprecise, including “the books of children’s fiction were 38%” and “illustrates differet litlle chalfont Library according to different categories.” Repeated use of “the number of loans was” also makes the account sound mechanical. There are spelling and form errors, including “differet,” “litlle,” and “Morever.” Use concise terms suited to data reporting, such as “accounted for,” “share,” and “loan total,” and check spelling and capitalisation of names and category labels.
Grammatical Range and Accuracy: Band 5.0
Most sentences use simple structures, and the reader can usually understand the intended figures. There are attempts to combine information with “while,” but sentence control is inconsistent. For example, “While children’s non-fiction were 6%. And the books of children’s DVDs were 1%” creates a fragment and an incorrectly separated sentence; “The adult non-fiction books were 13%” also needs a clearer grammatical relationship between the category and its share. Capitalisation and punctuation are inconsistent, with unnecessary full stops and spaces around sentence boundaries. Practise complete sentences such as “Children’s non-fiction accounted for 6%, while DVDs made up 1%,” and vary sentence patterns while checking agreement and punctuation.
See this exact question answered at other band scores. The same prompt compared across bands.
Browse more IELTS Writing model answers or get your own writing scored by the same AI examiner.