Band 6.0 IELTS Writing Task 1 Model Answer
Overall Band Score: 6.0 · Cambridge IELTS 20 · 2026-11-11
IELTS Writing Task 1 question
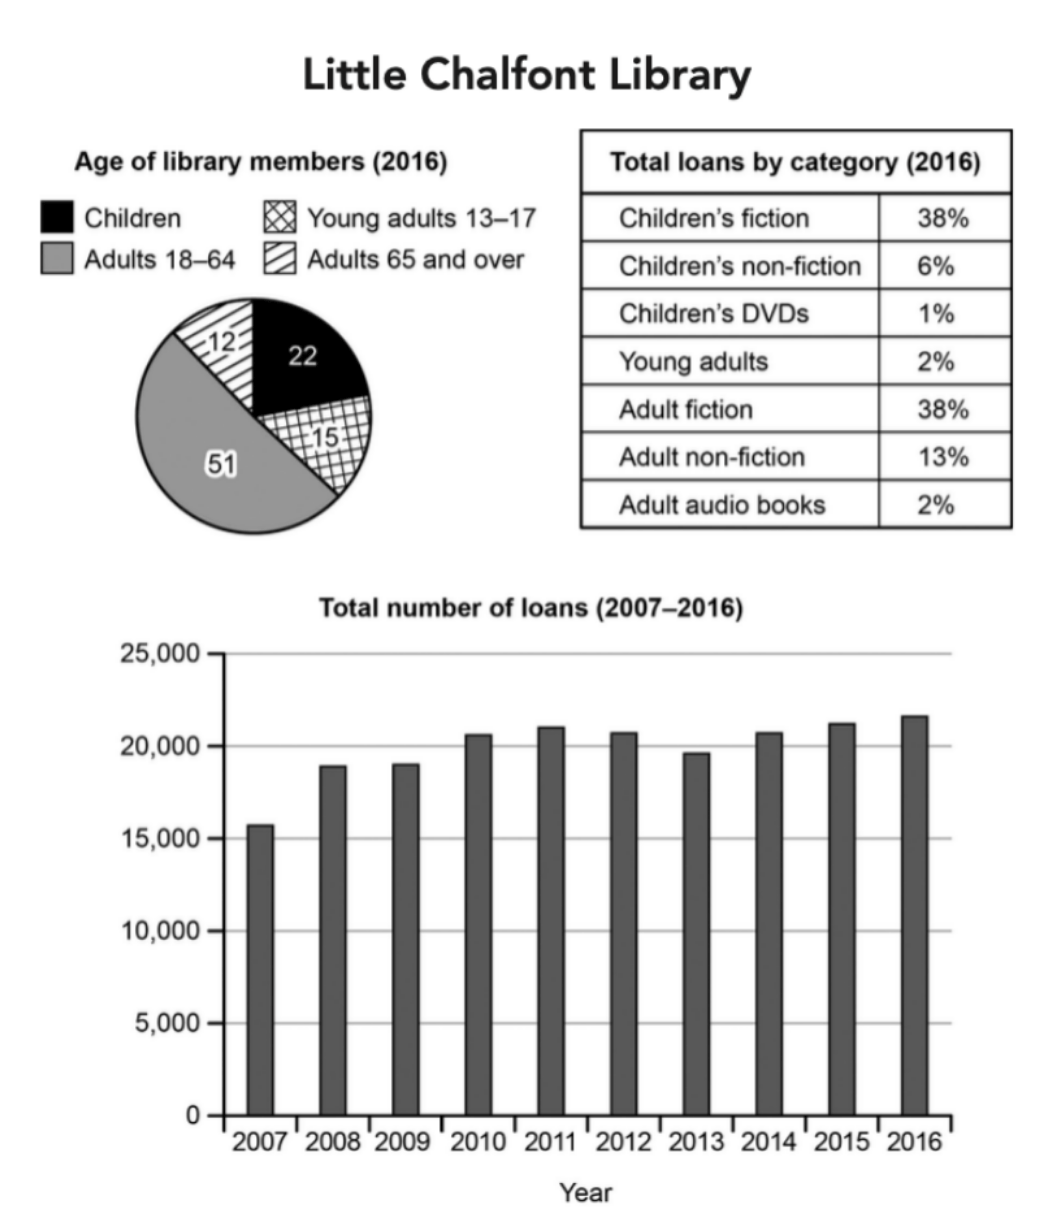
The charts below give information about a public library in a town called Little Chalfont.
Summarise the information by selecting and reporting the main features, and make comparisons where relevant.
Student answer (Band 6.0)
the pie chart, table and bar chart illustrates different aspects of little chalfont library,including the age distribution of its members,the category of materials borrowed in 2016 and the total number of loan between 2007 and 2016.
overall adults age 18-64 represented the largest portion of library members.Further more the total number of loans shows an overall upward trend throughout the period.
looking at the pie chart adults age 18 to 64 accounted for 51% of library membership,making them the largest group.Children reprsented 22% followed by young adults age 13 to 17 at 15%.Those aged 65 and over are the smallest at 12 %.Regarding borrowing categories childerns and adults fiction each accounted for 38% of total loan. Adults non fiction is 13 % and childern non fiction made up of 6%.
Turning to the bar chart the number of loans added to approximately 15500 in 2007. It increases to 18800 in 2008 and continued to flacuate over the years to approximately 21700 in 2016.
AI examiner evaluation
| Criterion | Band |
|---|---|
| Task Achievement / Task Response | 6.0 |
| Coherence and Cohesion | 6.5 |
| Lexical Resource | 6.0 |
| Grammatical Range and Accuracy | 6.0 |
| Overall | 6.0 |
Task Achievement / Task Response: Band 6.0
You cover the three visuals and give a relevant overview, identifying adults aged 18–64 as the largest membership group and noting that loans rose overall. Several key figures are reported accurately, including the membership shares and the two 38% fiction categories. However, the borrowing summary omits notable categories such as adult audio books, children’s DVDs and the 2% young-adult share. The trend description is also underdeveloped: the chart shows loans rising from about 15,700 to 21,700, with fluctuations, but the response does not describe the main stages or identify the peak. The opening says “bar chart” although the visual is a line graph. More selective detail and a fuller account of the trend would make the report more complete.
Coherence and Cohesion: Band 6.5
The response has a clear overall arrangement: an introduction, an overview, and separate discussion of membership and borrowing before the loan trend. Linking phrases such as “Overall,” “Looking at” and “Turning to” help readers follow this sequence, and the information is generally easy to understand. This shows coherent organisation, though some connections feel formulaic and the final paragraph is much less developed than the earlier discussion. The transition from membership figures to borrowing categories is understandable, but the report could group related comparisons more deliberately and use clearer references to distinguish the three visuals. More balanced paragraph development and less reliance on stock transitions would make the progression more flexible.
Lexical Resource: Band 6.0
You use an adequate range of task-related vocabulary, including “age distribution,” “accounted for,” “largest group,” “total loans” and “overall upward trend.” These choices communicate the main information, and some phrasing is appropriate for describing proportions. However, spelling and word-choice errors recur, for example “reprsented,” “childerns,” “flacuate” and “loan” where the plural is needed. “The number of loans added to” is also an inaccurate collocation for describing a chart value, and “bar chart” mislabels the visual. Check spelling carefully and choose precise reporting verbs and chart terminology; this would make the vocabulary more controlled without requiring unnecessarily complex wording.
Grammatical Range and Accuracy: Band 6.0
There is a mix of simple and more developed sentence forms, and the meaning is usually clear. For example, “Children represented 22%, followed by young adults…” combines information effectively, while the overview uses a straightforward comparative structure. Some grammatical errors remain, including subject–verb agreement in “the pie chart, table and bar chart illustrates,” missing or inconsistent articles in phrases such as “the largest portion,” and tense or form problems in “It increases” and “made up of 6%.” Punctuation and spacing are also inconsistent, particularly around commas and percentages. Review agreement, article use and consistent past-tense reporting, then proofread sentence boundaries and punctuation. These corrections would improve accuracy while preserving the range already attempted.
See this exact question answered at other band scores. The same prompt compared across bands.
Browse more IELTS Writing model answers or get your own writing scored by the same AI examiner.