Band 6.0 IELTS Writing Task 1 Model Answer
Overall Band Score: 6.0 · Cambridge IELTS 20 · 2026-11-11
IELTS Writing Task 1 question
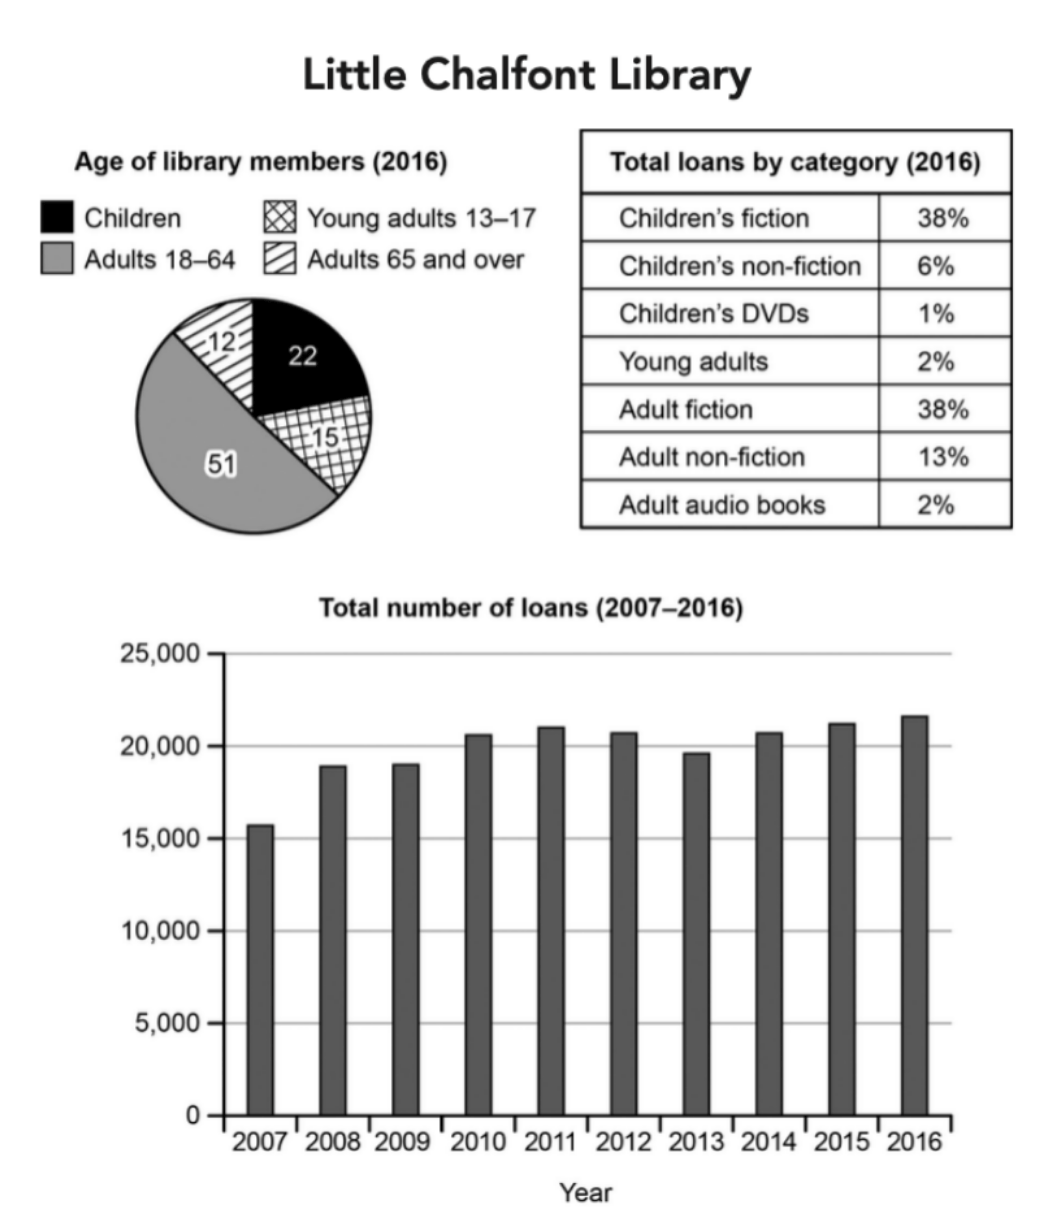
The charts below give information about a public library in a town called Little Chalfont.
Summarise the information by selecting and reporting the main features, and make comparisons where relevant.
Student answer (Band 6.0)
The pie chart and bar graph demonstrates the data about a differnt age public groups library in a town known as little chalfont.
Overall, it can be witnessed that greater portion of library members were adults 18-64 and children's dvds loan was least in 2016.In adition, the total number of loans was highest in 2016.
To commence with, adults 18-64 members was the 51% of the whole proportion. Which was the highest figure in the pie chart. The children members contributed 22% in 2016 and young adults 13-17 were 15% in 2016. The adults 65 and over were 12% part of the whole members.Which is lowest figure in the pie chart. Furthermore, the loan by children's fiction and adult fiction were same 38% in 2016. Which was the highest loan in this year. The young adults and adult audio books were same 2% in 2016. The loans by children's in dvds were lowest than other.
Further analyzing the bar graph, it can be noticed that 16,000 loans in 2007. which were the minimum loan as compared to others. The total number of loans fluctuate with the passage of time and reached at 22,000 loans in 2016. Which was the highest loan ratin in bar graph.
AI examiner evaluation
| Criterion | Band |
|---|---|
| Task Achievement / Task Response | 6.5 |
| Coherence and Cohesion | 6.5 |
| Lexical Resource | 5.5 |
| Grammatical Range and Accuracy | 5.0 |
| Overall | 6.0 |
Task Achievement / Task Response: Band 6.5
You cover all three visuals and identify several important features: adults aged 18–64 form the largest membership group, fiction accounts for the joint-largest loan shares, and loans peak in 2016. Most figures are accurately reported. However, the overview could compare the decade’s pattern more clearly: loans rose overall from about 15,700 in 2007, fluctuated, and then reached roughly 21,700 in 2016. The claim that adults aged 65 and over are the lowest membership group is incorrect; young adults are lower, at 15% versus 12% for the older group? In fact, the figures show 12% for adults 65 and over, so this is the smallest group. The main factual issue is calling 2007 the minimum while giving 16,000, a reasonable approximation of the actual 15,700. More precise synthesis and clearer comparisons would strengthen the response.
Coherence and Cohesion: Band 6.5
The response has a recognisable structure: an introduction, an overview, a paragraph on membership and loan categories, and a final paragraph on the trend. This gives the reader a coherent route through the visuals, and phrases such as “Furthermore” and “Further analyzing” signal transitions. However, cohesion is sometimes mechanical, and several sentence fragments interrupt the flow: “Which was the highest figure in the pie chart” and “Which was the highest loan in this year” should be joined to the preceding sentences. Repeatedly beginning statements with “The…” also makes the report list-like. Group related comparisons more smoothly and use clear references, especially when moving between membership percentages and loan shares.
Lexical Resource: Band 5.5
You use relevant task vocabulary, including “members,” “proportion,” “contributed,” “fluctuate,” and “total number of loans,” so the topic is generally clear. However, the range and control are limited by awkward or inaccurate expressions such as “a differnt age public groups library,” “loan rating,” “lowest than other,” and “reached at.” Spelling errors, including “differnt,” “adition,” and “chalfont,” are also noticeable. Some phrases repeat basic wording such as “highest figure” and “total number of loans.” Aim for precise chart language and natural collocations—for example, describe a category as having the “smallest share” and a trend as “rising overall despite fluctuations.”
Grammatical Range and Accuracy: Band 5.0
You attempt both simple statements and longer comparisons, and the main message is usually understandable. However, grammatical control is uneven, with errors in agreement, sentence boundaries, and clause construction. For example, “The pie chart and bar graph demonstrates” needs a plural verb, while “adults 18-64 members was” has a subject–verb agreement problem. Several clauses beginning with “Which” are fragments rather than complete sentences. Punctuation also creates run-ons or missing spaces, as in “members.Which.” Work on forming complete sentences and checking subject–verb agreement, articles, and plural forms. More accurate control of these basic patterns would make the information easier to follow.
See this exact question answered at other band scores. The same prompt compared across bands.
Browse more IELTS Writing model answers or get your own writing scored by the same AI examiner.