Band 5.0 IELTS Writing Task 1 Model Answer
Overall Band Score: 5.0 · Cambridge IELTS 20 · 2026-11-11
IELTS Writing Task 1 question
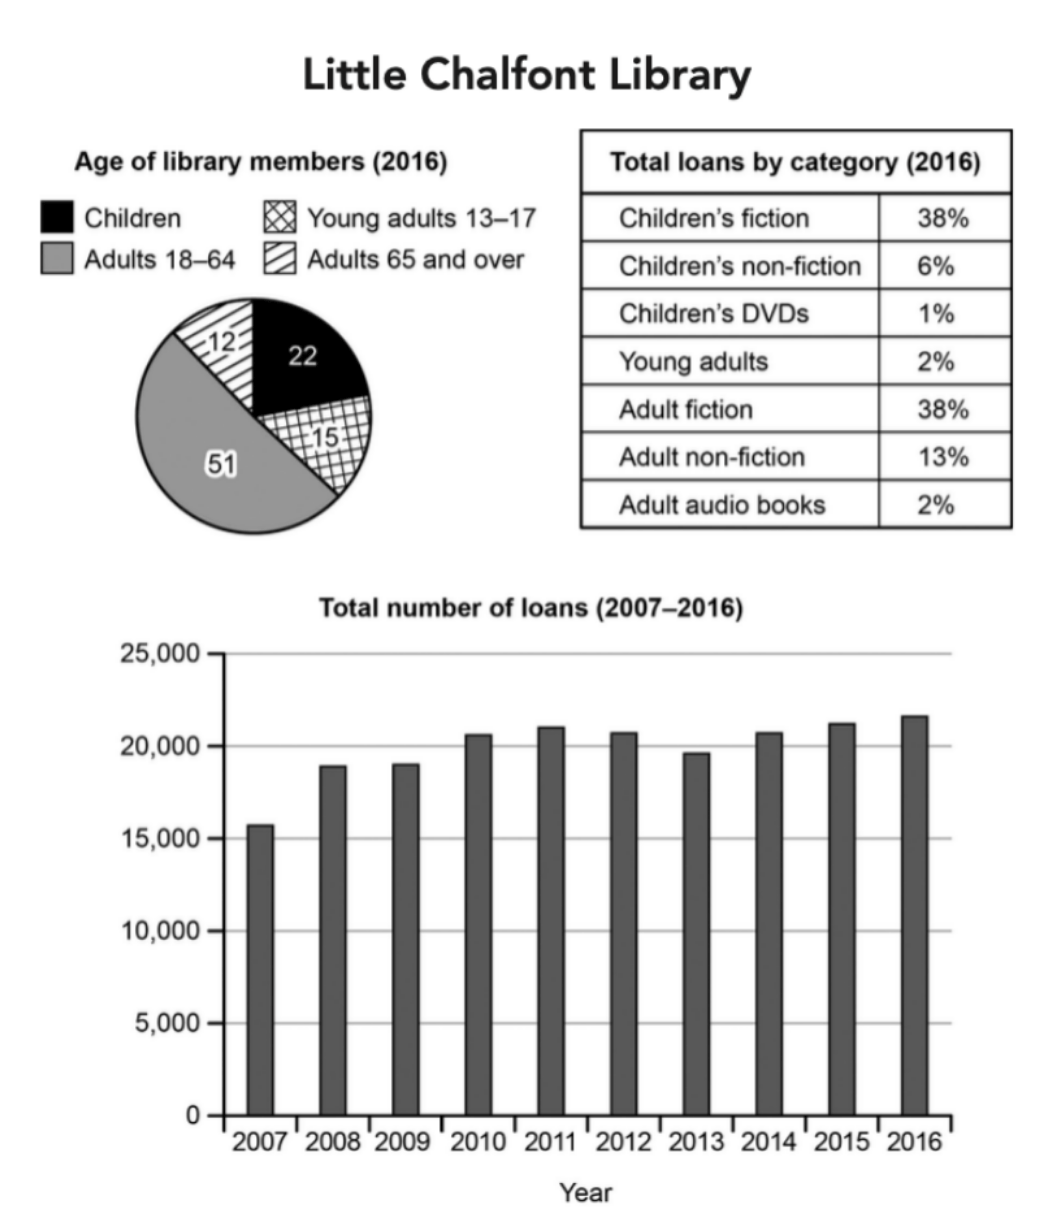
The charts below give information about a public library in a town called Little Chalfont.
Summarise the information by selecting and reporting the main features, and make comparisons where relevant.
Student answer (Band 5.0)
This picture is about the chilfont library and some percentages showed as well as graphs to represent the number of people came up with vogue of CDs and DVDs.So it tells us that childeren are twenty two percent that borrow child fiction .It shows that most of the age that borrows are at the age of eighteen to sixty four.It means most of the adults are borrowing the DVDs and the CDs to spend their leisure time.Furthermore, most of the DVDs taken are the of child fiction and adult fiction which are both thirty eight percent respectively.Apart from the table given there is a graph that illustrates the number of loans taken in the past years.This graph only shows the years from [redacted phone].The years [redacted phone] and [redacted phone], were the peak of years in terms of loans by going more than twenty thousand loans in the those years.These are the impressive numbers.
AI examiner evaluation
| Criterion | Band |
|---|---|
| Task Achievement / Task Response | 5.5 |
| Coherence and Cohesion | 5.0 |
| Lexical Resource | 5.0 |
| Grammatical Range and Accuracy | 5.0 |
| Overall | 5.0 |
Task Achievement / Task Response: Band 5.5
You identify several relevant features, including the largest membership group (adults aged 18–64) and the equal 38% shares for children’s fiction and adult fiction. You also note that loans exceeded 20,000 in several later years. However, some details are misinterpreted: 22% refers to children’s membership, not the proportion borrowing children’s fiction, and the chart does not show that adults mainly borrowed DVDs and CDs. The description also lacks a clear overview of the overall loan trend, which rose from about 15,700 in 2007 to 21,700 in 2016, with fluctuations. To strengthen the response, distinguish membership figures from loan categories and summarise the main trend accurately before selecting supporting details.
Coherence and Cohesion: Band 5.0
The response moves from membership information to loan categories and then to the time-series graph, so the reader can recognise the broad order of the charts. Linking expressions such as “Furthermore” and “Apart from the table given” also show an attempt to connect ideas. However, the information is presented as one continuous paragraph, and the progression is weakened by unclear links between figures—for example, the statement about children being 22% is immediately connected to borrowing children’s fiction. Some transitions are awkward or repetitive, and the final comment, “These are the impressive numbers,” does not add a precise summary. Use separate paragraphs for the charts and organise each around a clear main feature followed by evidence.
Lexical Resource: Band 5.0
You use some task-related vocabulary, including “percentages,” “illustrates,” “loans,” “peak,” and “respectively,” which helps communicate the subject. However, the range is limited and several choices are inaccurate or unnatural. “Came up with vogue of CDs and DVDs” does not clearly describe the data, while “the number of people came up with” is not an appropriate way to refer to library members. “The years … were the peak of years” is also an awkward collocation, and “impressive numbers” is subjective rather than suitable for an objective report. Spelling errors such as “chilfont” and “childeren” further reduce precision. Build a reliable set of chart verbs and nouns, such as “accounted for,” “membership,” and “loan total.”
Grammatical Range and Accuracy: Band 5.0
You attempt both simple and more extended sentences, using structures such as “It means…” and “Apart from the table given there is a graph that illustrates…”. However, control is inconsistent, and errors sometimes make relationships between ideas difficult to follow. For example, “the number of people came up with” is missing a grammatical link, and “the years 2010-2012 and 2014-2016, were the peak” has faulty sentence structure and punctuation. There are also problems with articles and prepositions in “at the age of eighteen to sixty four” and “in the those years.” Aim for shorter, complete sentences first, then add accurate comparisons using patterns such as “Adults aged 18–64 made up…” and “Loans rose to…”.
See this exact question answered at other band scores. The same prompt compared across bands.
Browse more IELTS Writing model answers or get your own writing scored by the same AI examiner.