Band 5.5 IELTS Writing Task 1 Model Answer
Overall Band Score: 5.5 · Cambridge IELTS 20 · 2026-11-12
IELTS Writing Task 1 question
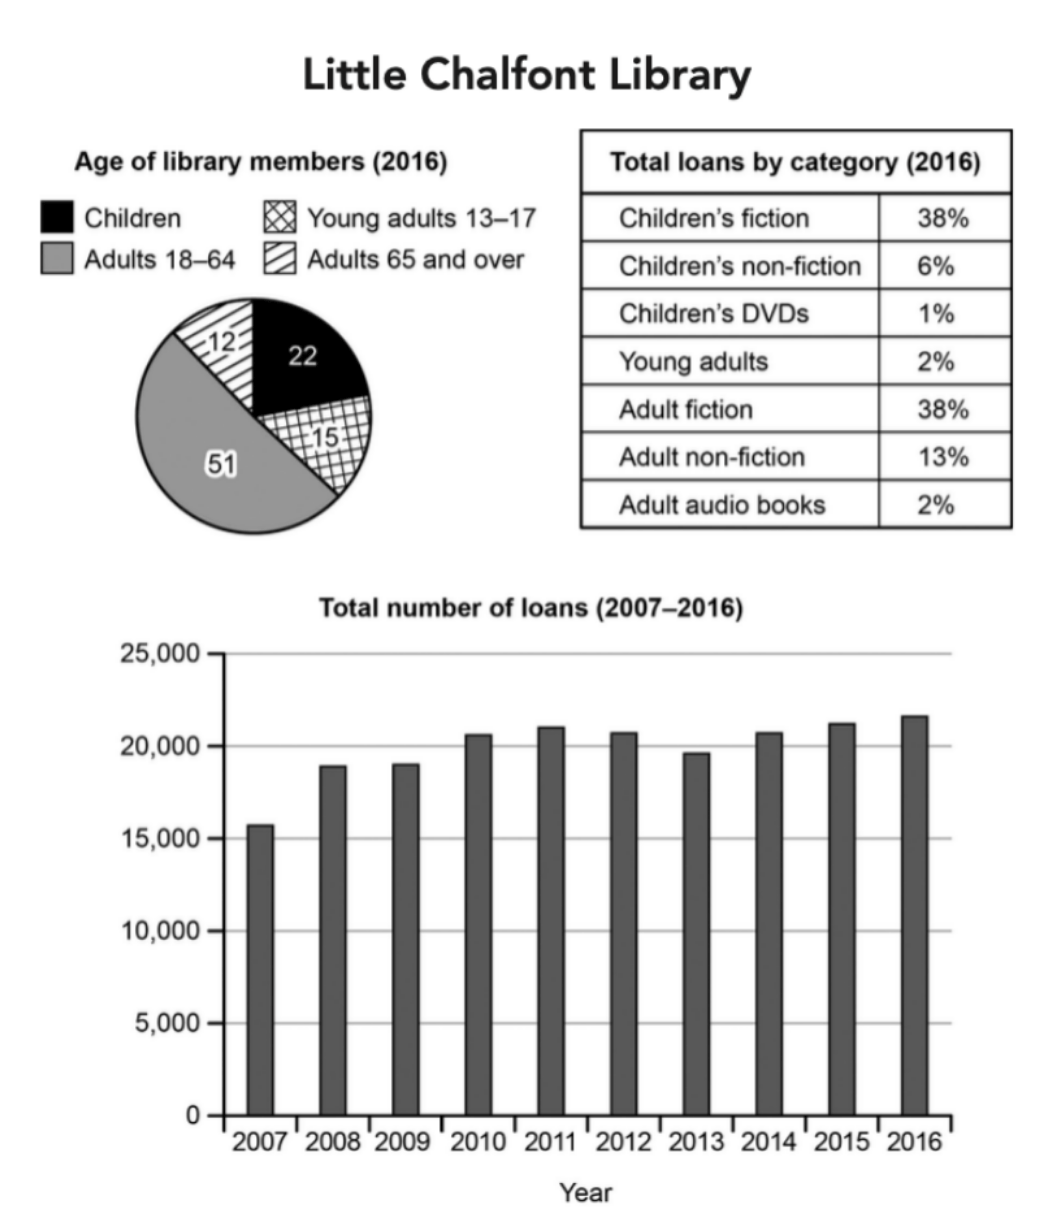
The charts below give information about a public library in a town called Little Chalfont.
Summarise the information by selecting and reporting the main features, and make comparisons where relevant.
Student answer (Band 5.5)
The given pie chart,table and bar chart portraits different data about Little Chalfont Library.
The pie chart portraits about different age groups of the Little Chalfont Library as per year 2016.The table shows the total loans by category and the bar chart shows the total number on loans from 2007 to 2016.
From the pie chart it is clearly visible that most of the member of the library is adults aging between 18 to 64 years.The adults group over 65 years also share a small chunk of the pie chart.For this reason, the loans percentage by category is significat among the adults. The children category shares 22 percentage in the pie chart but their loan percentage is noticable despite their small percentage of membership.Young adults shares less noticable part in the pie chart.Also, their loaning percentage is merely visible.
Now if we look at the bar chart, most number of loans were taken in the year 2016 and least were in 2007. From the year 2008 to year 2012 there is a steady increment in the number of loans. But there is a sudden drop in 2013. After that the increment is again stable.
AI examiner evaluation
| Criterion | Band |
|---|---|
| Task Achievement / Task Response | 5.0 |
| Coherence and Cohesion | 5.5 |
| Lexical Resource | 5.5 |
| Grammatical Range and Accuracy | 5.5 |
| Overall | 5.5 |
Task Achievement / Task Response: Band 5.0
You identify the three visuals and report several relevant features, including the dominance of adults aged 18–64 in membership, the low share of young adults, and the rise in loans to a peak in 2016. However, the response only partially summarises the data: it gives no figures for the membership groups or loan categories, and the comparison that adult loans are significant is not clearly supported by the table, where adult fiction is 38% and adult non-fiction 13%. The trend description also misses the overall pattern: loans generally rose from about 15,700 to 21,700, with fluctuations rather than a steady increase through 2012 or a stable rise afterwards. A concise overview and accurate key figures would make the main features clearer and better supported.
Coherence and Cohesion: Band 5.5
The response has a recognisable structure: an introduction, a paragraph about the pie chart and table, and a final paragraph on the bar chart. This helps the reader follow the broad sequence of the visuals. Linking phrases such as “Now if we look at the bar chart” and “After that” also signal movement between points. However, the progression within the middle paragraph is less clear because membership shares and loan percentages are compared without specific figures or a clear explanation of the relationship. Some transitions are mechanical, and the opening repeats “The pie chart” and “The table” rather than establishing an overall summary. Grouping the key comparisons more deliberately and using clearer references between visuals would improve cohesion.
Lexical Resource: Band 5.5
You use some relevant chart vocabulary, including “age groups,” “percentage,” “category,” “increment,” and “drop,” so the topic is generally clear. There is also an attempt to vary wording when describing the charts. However, several choices are inaccurate or unnatural, such as “portraits” for what the charts show, “loaning percentage,” and “most number of loans.” Repetition of “visible” and “percentage” also limits precision, while spelling errors such as “significat” and “noticable” reduce control. Choose standard reporting language and precise terms for proportions and trends; for example, describe loans as “accounting for” a share and figures as “rising” or “fluctuating.” This would make the description more natural and exact.
Grammatical Range and Accuracy: Band 5.5
You produce a mixture of simple statements and some longer sentences, and the main meaning is usually understandable. However, grammatical control is uneven. For example, “most of the member … is adults” has problems with number agreement, while “Young adults shares” also uses an incorrect verb form. The sentence beginning “The children category shares 22 percentage … but their loan percentage…” has unclear pronoun reference and awkward sentence construction. There are also missing spaces after commas and full stops, as in “chart,table” and “2016.The.” Most sentences rely on straightforward patterns, so the range is limited. Check subject–verb agreement, articles, plural forms, and punctuation, and practise combining comparisons in accurate complex sentences.
See this exact question answered at other band scores. The same prompt compared across bands.
Browse more IELTS Writing model answers or get your own writing scored by the same AI examiner.