Band 4.5 IELTS Writing Task 1 Model Answer
Overall Band Score: 4.5 · Cambridge IELTS 20 · 2026-11-12
IELTS Writing Task 1 question
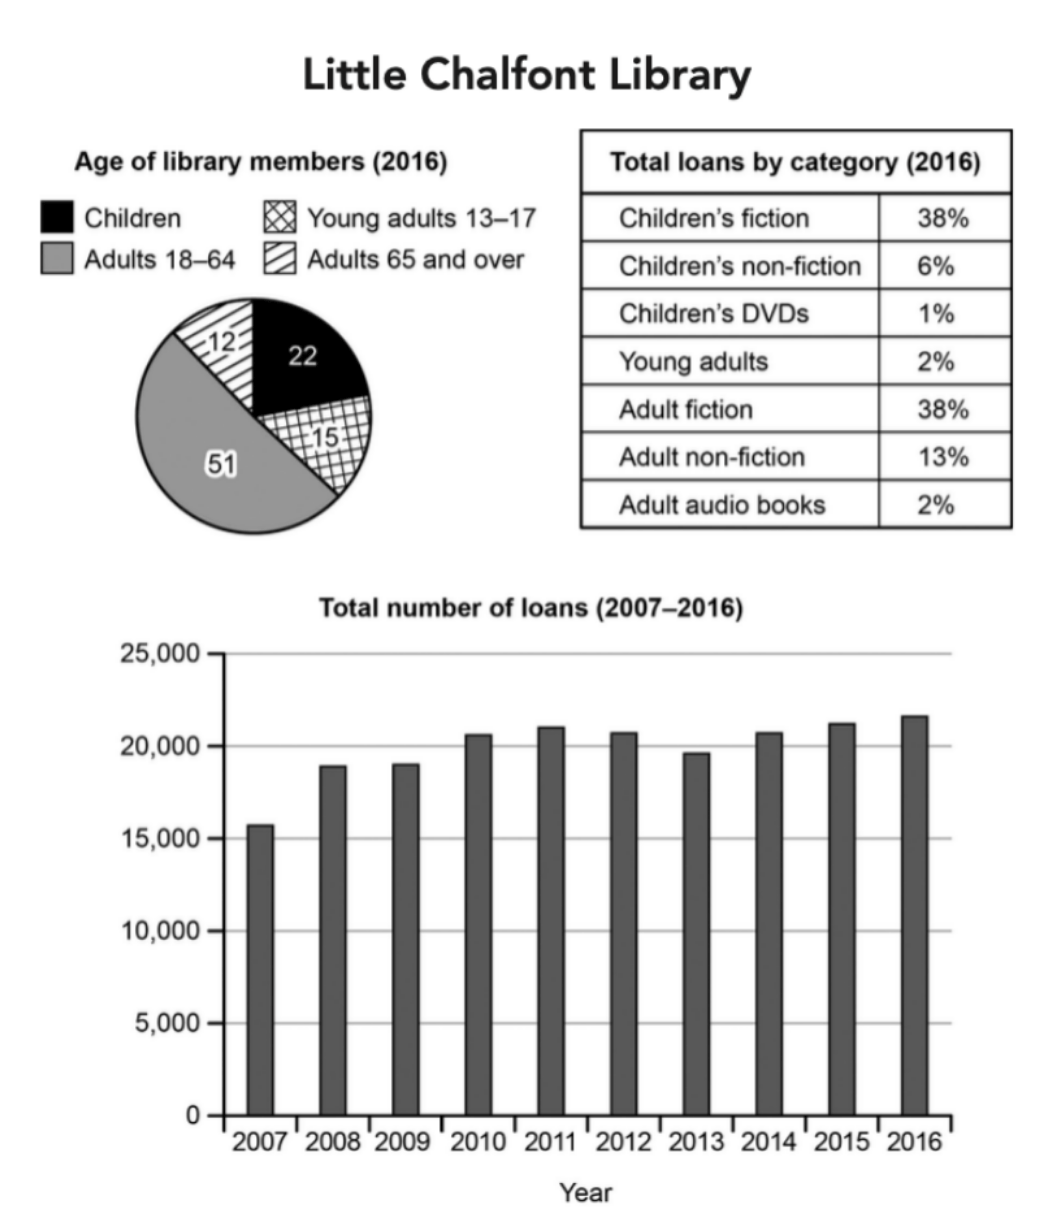
The charts below give information about a public library in a town called Little Chalfont.
Summarise the information by selecting and reporting the main features, and make comparisons where relevant.
Student answer (Band 4.5)
The graph demonstrates the information regarding a public library in a area known as Little Chalfont.
Overall different number of loan are shown in the graphs and from year 2007 to 2016.
There are different varities of laon and age of library members are also mentioned in the table in question, which include childern, teenagers and adults of different ages.
To begin with year 2007 the loan increased from 5000 to 15000 then in years 2008 and 2009 it went up till 18000 and after it in 2010 moved a bit till 21000 then there is fluctuations between years 2011 and 2012. In 2013 it dropped a little but right next two years i.e. 2014 and 2015 it again moved upward to 20000 and 21000 amd following the trend it reached till 22000.
There is table shown illustrating various categories of loan including childrens fiction and non fiction, DVDs
Teenagers fiction and non fiction and their audio books.
AI examiner evaluation
| Criterion | Band |
|---|---|
| Task Achievement / Task Response | 4.0 |
| Coherence and Cohesion | 4.5 |
| Lexical Resource | 5.0 |
| Grammatical Range and Accuracy | 5.0 |
| Overall | 4.5 |
Task Achievement / Task Response: Band 4.0
The response identifies the three kinds of information shown and attempts to describe the loan trend, but it reports the charts only minimally and omits key features. The overview is vague (“different number of loan are shown”) rather than highlighting that membership is concentrated among adults aged 18–64 and that fiction accounts for the largest share of loans. Several figures in the trend are inaccurate: loans were about 15,700 in 2007, not 5,000, and the 2008–09 total was about 19,000, not 18,000. The table is merely named; its percentages and the age-group figures are not reported. To improve, select the main comparisons and give accurate supporting figures, including the overall rise in loans and the dominant categories.
Coherence and Cohesion: Band 4.5
There is some basic organisation: the response begins with an introduction, gives a brief overview, and then moves to the line graph before mentioning the table. However, progression is limited because the overview does not summarise the main patterns, and the final paragraph stops after listing categories without explaining their proportions. Linking phrases such as “To begin with,” “after it,” and “following the trend” show an attempt to connect events, but some are awkward or unclear, and the sequence of figures is difficult to follow. The response would be clearer with separate, purposeful paragraphs for the overview, membership and loan categories, and the trend over time, using comparisons to connect related information.
Lexical Resource: Band 5.0
The response uses a small range of relevant terms, including “increased,” “dropped,” “fluctuations,” and “categories,” so the general subject is usually recognisable. However, vocabulary is repetitive and several word choices or spellings reduce precision: “varities,” “laon,” “childern,” and “amd” are errors, while “moved a bit” and “went up till” are informal or imprecise for an academic report. “Different number of loan” also does not express the chart information naturally. Use accurate chart language such as “the total number of loans,” “rose to,” “declined slightly,” and “accounted for,” and check spelling carefully. More precise terms would help distinguish membership figures from loan percentages.
Grammatical Range and Accuracy: Band 5.0
The response attempts both simple and longer sentences, but control is uneven and errors are frequent enough to make some relationships unclear. For example, “in a area known as Little Chalfont” has an article error, and “Overall different number of loan are shown” has problems with number agreement and sentence structure. The long trend sentence beginning “To begin with year 2007” combines several stages without clear grammatical boundaries, making the timeline hard to follow. There is also inconsistent punctuation and spacing, including the unfinished list at the end. Practise accurate sentence patterns for describing change, such as “Loans rose from approximately X in 2007 to Y in 2008,” and use full stops to separate distinct comparisons.
See this exact question answered at other band scores. The same prompt compared across bands.
Browse more IELTS Writing model answers or get your own writing scored by the same AI examiner.