Band 4.0 IELTS Writing Task 1 Model Answer
Overall Band Score: 4.0 · Cambridge IELTS 20 · 2026-11-13
IELTS Writing Task 1 question
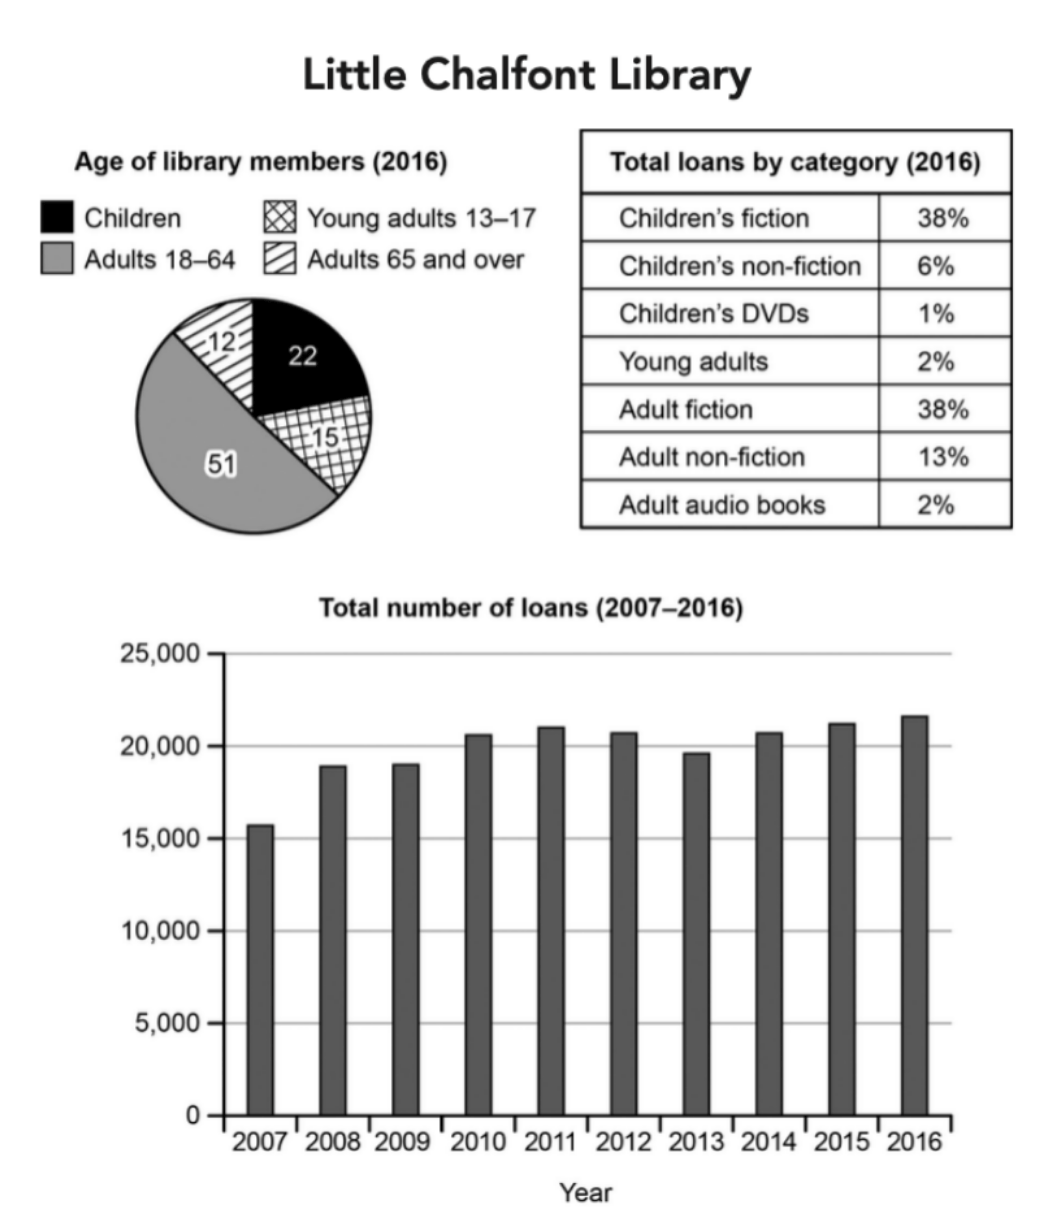
The charts below give information about a public library in a town called Little Chalfont.
Summarise the information by selecting and reporting the main features, and make comparisons where relevant.
Student answer (Band 4.0)
The pie chart illustrates the age distribution of differnt type of library material loans borrowed over a period of one year.according to genrewhile the bar chart compares the book loan over a ten year period.Childern are around 22% while adults aupto 17 year old are 15 % and adults ranging from 17 to 64 year old are in majority and only 12% individuals are above 65 51% individulsa12%hile bar chart shows the the individuals according to their age with young ones aged from 13 to 17 year old are about 15 % and adults over 65 year are 15% while adults having age 18 to 64 are in majority around 51%. while bar chart compares the amount of loan taken by different age groups over a decaded from 2007.
AI examiner evaluation
| Criterion | Band |
|---|---|
| Task Achievement / Task Response | 3.5 |
| Coherence and Cohesion | 3.5 |
| Lexical Resource | 5.0 |
| Grammatical Range and Accuracy | 4.5 |
| Overall | 4.0 |
Task Achievement / Task Response: Band 3.5
The response makes a limited attempt to describe the charts, mentioning age groups and a ten-year loan period, but it does not provide a clear overview of the main features. It also confuses the visuals: the age figures are presented as if they describe loans, and the response refers to a “bar chart” comparing age groups when the chart shows total loans over time. Several figures are inaccurate or unclear: adults aged 18–64 are reported as 51%, but the children’s figure is inconsistently given, and the over-65 figure is first stated as 12% and later as 15%. The category breakdown and the trend in total loans are not meaningfully summarised. The response is 21 words below the required minimum, further limiting its coverage. To improve, report each chart’s subject accurately and select key comparisons and trends.
Coherence and Cohesion: Band 3.5
There is a basic attempt to move from the charts to age-group figures and then to loans over time, but the information is not arranged into a clear, logical summary. The response is presented as one long, run-on sequence, with no paragraphing or distinct overview. Connections such as “while” are repeated without clearly showing how the ideas relate, and the final clause about loans from 2007 is left incomplete. Repetition also makes the progression difficult to follow: the age distribution is described twice, with conflicting details. Organise the response into an introduction, an overview, and focused detail paragraphs, one for the age and loan-category charts and one for the time series. Use linking expressions only where they clarify comparisons.
Lexical Resource: Band 5.0
The response uses some relevant vocabulary, including “age distribution,” “majority,” “loan,” and “over a ten year period,” so the topic is generally recognisable. However, the range is limited and several word choices or forms are inaccurate, such as “different type of library material loans borrowed,” “book loan,” and “individualsa.” Spelling errors—including “differnt,” “Childern,” and “decaded”—are noticeable and reduce clarity. Some phrases are also imprecise: “adults aupto 17 year old” does not accurately name the young-adult group, and “individuals” is unnecessarily vague for library members. Build a more precise chart vocabulary, such as “members,” “loan categories,” “accounted for,” and “rose,” and check spelling and collocations before submitting.
Grammatical Range and Accuracy: Band 4.5
The response attempts to combine information using clauses and contrast markers, but sentence control is weak. The opening contains a sequence of fragments and clauses without reliable punctuation: “one year.according to genrewhile the bar chart…” The long sentence that follows has unclear structure, repeated material, and no effective separation between the age figures and the loan chart. There are also errors in number and agreement patterns, for example “different type” and “adults … are in majority,” as well as inconsistent sentence boundaries and spacing. These problems make relationships between figures difficult to understand. Practise writing short, complete sentences first, then add controlled comparisons with forms such as “whereas” or “while.” Use full stops and commas to separate each chart’s information.
See this exact question answered at other band scores. The same prompt compared across bands.
Browse more IELTS Writing model answers or get your own writing scored by the same AI examiner.