Band 6.0 IELTS Writing Task 1 Model Answer
Overall Band Score: 6.0 · Cambridge IELTS 20 · 2026-11-13
IELTS Writing Task 1 question
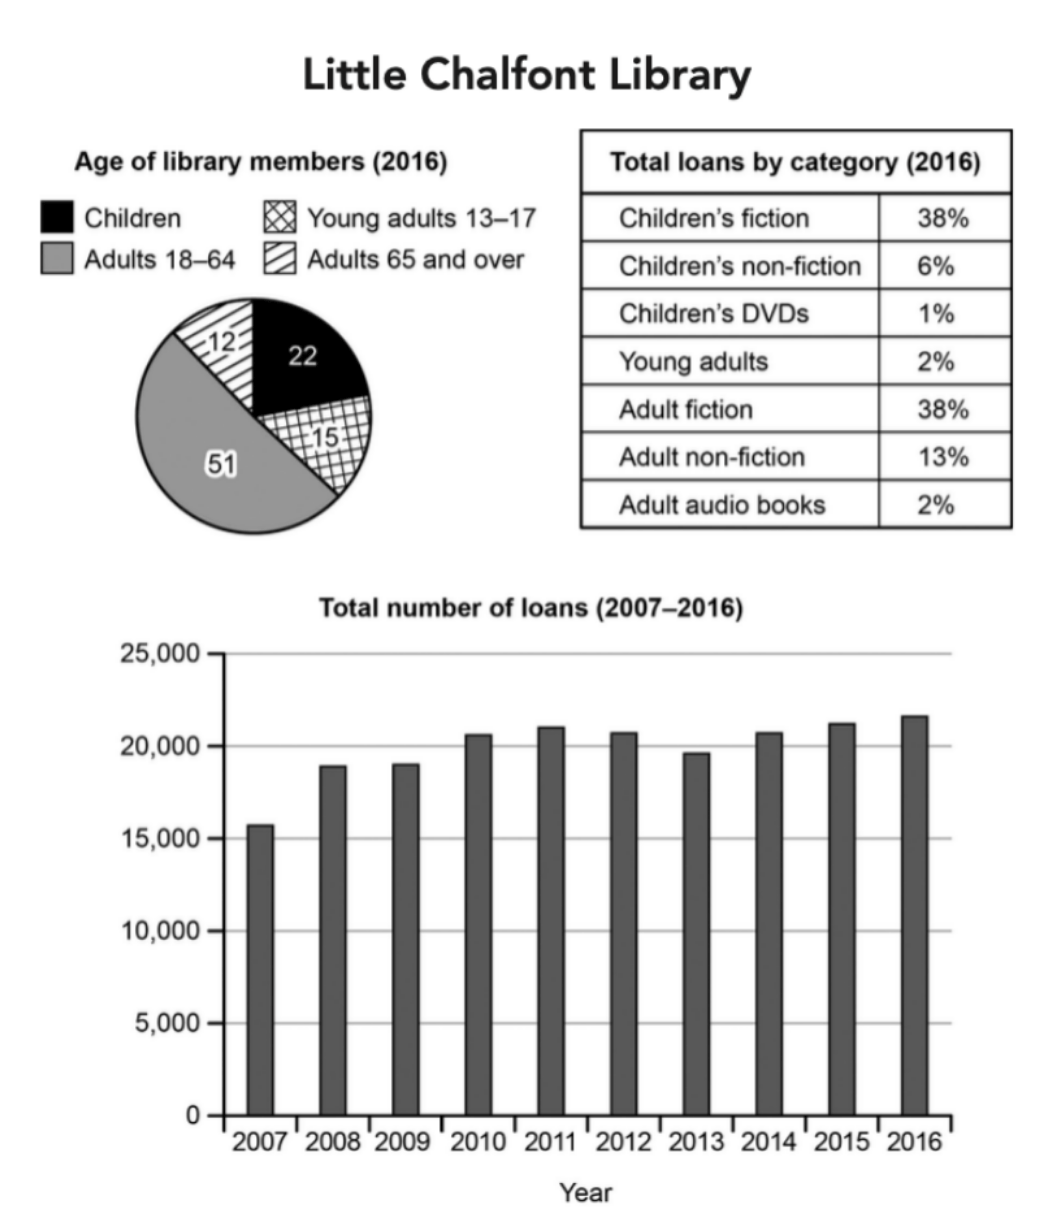
The charts below give information about a public library in a town called Little Chalfont.
Summarise the information by selecting and reporting the main features, and make comparisons where relevant.
Student answer (Band 6.0)
The pie chart provide information about different age groups members of the Little Chalfont library which located in a town.The table illustrates the cetagories of library items which borrowed in 2016 and bar chart represents 10 years data about how much things loaned.
Overall, the largest proportion of library users were adults and childrens similarly, the most borrowing categories also related to these members(Children's fiction and Adult fiction). In addition, the hishest number of items had loaned in same year in 2016 and this trend fluctuates throughout the period.
Regarding the library members in 2016, 51% adults aged from 18 to 64 years taken membership of public library and the second considerable group was children which accounted for 22%. Furthermore, young adults with age between 13-17 years represented 15% participation followed by the least accounted group of adults whose age were 65 years and over with 12%.
Apart from this, the most loaned categories were children's fiction and adult fiction in 2016 both with 38% and the two more categories with same proportion of loans were young adults and adults audio books those experienced at 2% additionally, the smallest category was children's non-fiction subsituted 1% of the total. On the other hand, the numbers of items which borrowed from library shows up and down trend in given time period which started from just above 15000 in 2007 and ends with approximately 22000 items in 2016.
AI examiner evaluation
| Criterion | Band |
|---|---|
| Task Achievement / Task Response | 6.5 |
| Coherence and Cohesion | 6.5 |
| Lexical Resource | 5.5 |
| Grammatical Range and Accuracy | 5.5 |
| Overall | 6.0 |
Task Achievement / Task Response: Band 6.5
You cover all three visuals and identify several key features accurately: adults aged 18–64 form the largest membership group at 51%, fiction leads both children’s and adult borrowing at 38%, and loans rise overall from about 15,700 to 21,700. The overview also notes the prominence of adults and fiction. Some details, however, are misreported: children’s non-fiction accounts for 6%, not 1%; children’s DVDs are the smallest category at 1%; and adult audio books, rather than “adults audio books,” account for 2%. The trend description is also too general: loans peak at about 21,700 in 2016 after several fluctuations, rather than simply showing an unspecified “up and down” pattern. More precise reporting and a clearer overview of the loan trend would strengthen the response.
Coherence and Cohesion: Band 6.5
The response has a clear overall arrangement: an introduction, an overview, and separate paragraphs for membership, borrowing categories and loan totals. This makes the information easy to locate, and phrases such as “Regarding” and “Apart from this” signal shifts between topics. However, the final paragraph combines category comparisons with the decade-long trend, so the discussion becomes crowded and the trend receives little detail. Some linking is also awkward or unclear, particularly “On the other hand,” which suggests a contrast that is not really established. Consider giving the loan chart its own focused paragraph and using more precise links between comparisons. This would make the progression more consistently logical and reduce the sense of mechanically added transitions.
Lexical Resource: Band 5.5
You use some relevant task vocabulary, including “proportion,” “accounted for,” “categories,” and “fluctuates,” and the reader can generally understand the comparisons. However, several word choices and collocations are inaccurate or unnatural, such as “items had loaned,” “taken membership,” “experienced at 2%,” and “shows up and down trend.” There are also spelling errors, including “cetagories,” “hishest,” and “subsituted,” which make the writing less controlled. The vocabulary range is adequate for describing the charts, but repeated reliance on broad terms such as “items” and “categories” limits precision. Use standard chart-reporting phrases and check spelling and word forms carefully.
Grammatical Range and Accuracy: Band 5.5
You attempt a mix of simple and more complex sentences, including clauses introduced by “which” and “whose,” and most of the main comparisons remain understandable. However, errors in verb forms, agreement, articles and sentence construction are noticeable. For example, “The pie chart provide” needs subject–verb agreement, while “which located in a town” is missing a verb. “51% adults … taken membership” has an incomplete grammatical structure, and “the numbers of items … shows” has a plural subject with a singular verb. The long opening sentence also needs clearer sentence boundaries and punctuation. Aim to build accurate basic clauses first, then add subordinate clauses; proofreading for agreement and complete verb phrases would improve control.
See this exact question answered at other band scores. The same prompt compared across bands.
Browse more IELTS Writing model answers or get your own writing scored by the same AI examiner.