Band 5.5 IELTS Writing Task 1 Model Answer
Overall Band Score: 5.5 · Cambridge IELTS 20 · 2026-11-14
IELTS Writing Task 1 question
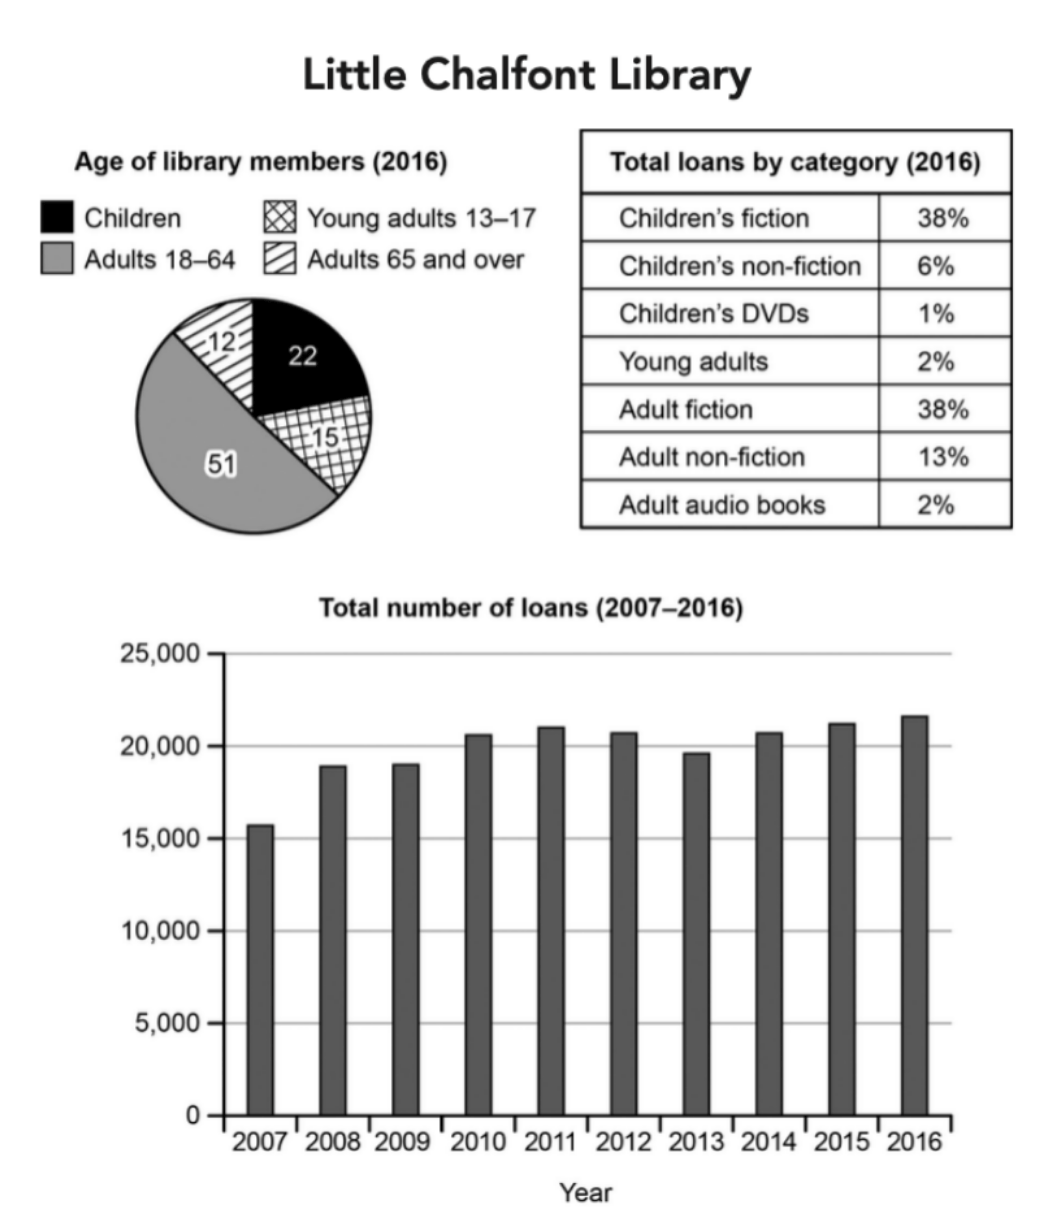
The charts below give information about a public library in a town called Little Chalfont.
Summarise the information by selecting and reporting the main features, and make comparisons where relevant.
Student answer (Band 5.5)
The pie chart and table charts illustrate a public library in a town which is known as Little Chalfont.
The pie chart was about the categories of age groups of library members in 2016. The childrens was 22% and young adults with the age of 13-17 was 15%. The adults with the age of 18-64 was the 51% which was the largest proportion of total members. While the adults 65 and above age members was the least proportion of library members with 12%.
The table chart gaves information about total loans by categories in 2016. In which childrens and adults fiction was the largest proportion with 38% and Young adults and adult audio books had also same percentage which was 2% but the lowest proportion was just 1% of childrens's DVDs.
Another table chart illustrate the total number of loans from 2007 to 2016. In 2007, about 16000 numbers of members was taken loans which was the smallest number of members but the largest number of members was about 22000 in 2016. but in 2010, 2011, 2012, 2014 and 2015 about more or less than 21000 members was taken loan but in 2008, 2009 and 2013 numbers was deacreased and about [redacted phone]0 members toke loan.
AI examiner evaluation
| Criterion | Band |
|---|---|
| Task Achievement / Task Response | 5.0 |
| Coherence and Cohesion | 6.0 |
| Lexical Resource | 5.5 |
| Grammatical Range and Accuracy | 5.0 |
| Overall | 5.5 |
Task Achievement / Task Response: Band 5.0
You identify the main categories in the membership and loan charts, and correctly report that adults aged 18–64 form the largest membership group (51%), while those aged 65 and over are the smallest (12%). You also note the two leading loan categories at 38% and the low share for children’s DVDs. However, the response only partly summarises the visuals: it has no clear overall overview of the decade-long trend, and the final paragraph repeatedly describes loan totals as numbers of “members” taking loans. Some figures are also inaccurate: children account for 22%, not “the childrens was 22%” as a percentage is implied unclearly, and the 2008–09 totals were about 19,000, not 18,000–19,000 as a decrease. Select the key trends and report them precisely.
Coherence and Cohesion: Band 6.0
The response is arranged in a generally understandable sequence, with separate paragraphs for membership, loan categories and the annual totals. This gives the reader a basic route through the information. However, progression within paragraphs is sometimes awkward, and linking is mechanical or unclear. For example, “While the adults 65 and above…” is not smoothly connected to the preceding sentence, and the final paragraph strings together several years with repeated “but” and “and.” The phrase “Another table chart” also misidentifies the visual and weakens the transition. Use a clear overview first, then group related comparisons, and connect them with precise contrasts such as “by comparison” or “after peaking.”
Lexical Resource: Band 5.5
You use enough topic vocabulary to identify the visuals and categories, including “largest proportion,” “total loans,” “fiction” and “non-fiction.” However, the range is limited and several word choices or collocations are inaccurate, sometimes making the meaning less clear. “Numbers of members was taken loans” confuses borrowers with loan totals, while “table chart” is not an appropriate label for the line graph. There are also noticeable spelling and word-form errors, such as “gaves,” “deacreased” and “toke,” and repeated use of “proportion” and “number.” Aim for accurate terms such as “loan total,” “share” and “rose/fell,” and check spelling and plural forms.
Grammatical Range and Accuracy: Band 5.0
The response attempts some longer sentences and comparisons, but its grammatical range is limited and errors occur frequently enough to make parts difficult to follow. Examples include “The childrens was 22%,” “The table chart gaves information,” and “about more or less than 21000 members was taken loan,” where agreement, verb forms and sentence construction are faulty. The final paragraph also shifts between singular and plural forms and uses punctuation inconsistently, including a lower-case “but” after a full stop. Build more reliable simple sentences before adding complex clauses; for example, state each figure with a clear subject and verb, then use a separate sentence to compare it with another category or year.
See this exact question answered at other band scores. The same prompt compared across bands.
Browse more IELTS Writing model answers or get your own writing scored by the same AI examiner.