Band 5.0 IELTS Writing Task 1 Model Answer
Overall Band Score: 5.0 · Cambridge IELTS 20 · 2026-11-14
IELTS Writing Task 1 question
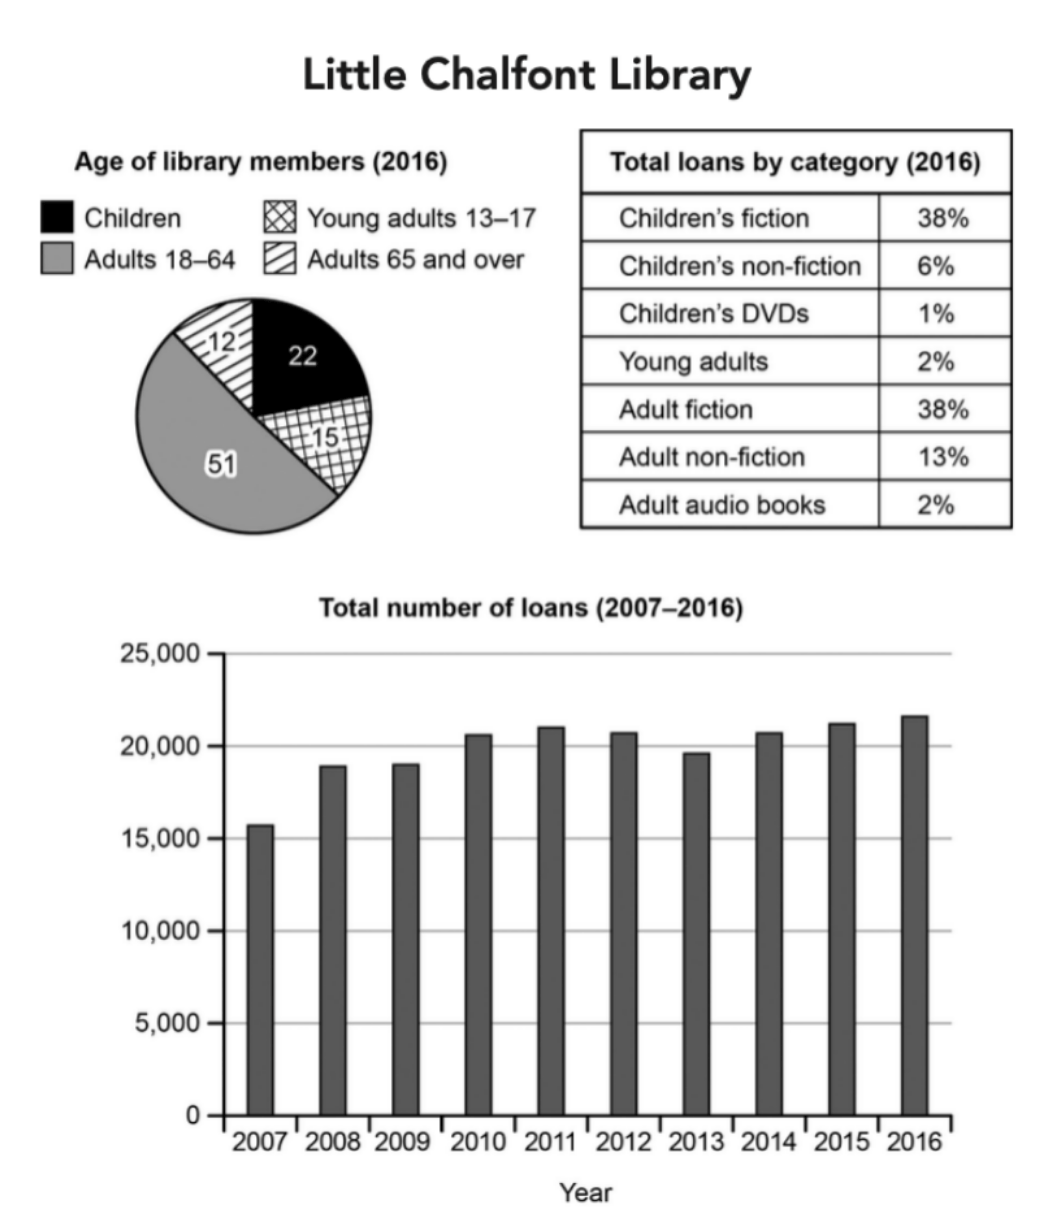
The charts below give information about a public library in a town called Little Chalfont.
Summarise the information by selecting and reporting the main features, and make comparisons where relevant.
Student answer (Band 5.0)
The bar chart compares below give information about a public library in a town called little chalfont.
Overall, the given bar chart demonstrate the little chalfont library and age of library memberes in 2016. The adults has the most 18-64 to 51%, while the lowest is adults 65 and over approximately 12%. Illustrates The total number number of loans from 2007 to 2016. In 2016 has the most number of loans, however, 2007 has the lowest number of loans only 16,000.
On the one hand, the total loans by category children's finction has the most 38%, while, the children's dvds has the lowest only 1%. Young adults 2%, adult fiction the same 38%.
On the other hand, the total number of loans 2016 has the most approximately, 23,000 , as compared to 2015 is eligible same 22,000. In 2007 only 16,000 number of loans, after this they increased step by step.
AI examiner evaluation
| Criterion | Band |
|---|---|
| Task Achievement / Task Response | 5.5 |
| Coherence and Cohesion | 5.0 |
| Lexical Resource | 5.0 |
| Grammatical Range and Accuracy | 5.0 |
| Overall | 5.0 |
Task Achievement / Task Response: Band 5.5
You identify relevant features from all three visuals, including the largest membership group (adults aged 18–64, 51%), the smallest loan category (children’s DVDs, 1%), and the overall rise in loans. However, the overview is unclear and some figures are inaccurate: 2007 is about 15,700, not 16,000 exactly, and 2016 is about 21,700, not 23,000; 2015 is about 21,200, rather than 22,000. The claim that loans increased “step by step” also misses the fluctuations after 2010. The response is 138 words, below the required 150, which limits the detail available. To improve, give a clear overview of the main patterns and report the key figures more accurately.
Coherence and Cohesion: Band 5.0
The response has some organisation: it begins with an introduction and overview, then separates category loans from the yearly totals. This gives the reader a basic sense of the chart groups. However, progression is not consistently clear. The overview combines membership and loan trends in a confusing way, and “On the one hand” and “On the other hand” do not establish a meaningful contrast between the two sets of information. Repetition in “the total number number of loans” and the abrupt final sentence also weaken flow. Use a clear paragraph for the overview, followed by one paragraph on membership and loan categories and another on the time trend, with linking phrases that show comparison or change accurately.
Lexical Resource: Band 5.0
You use some relevant chart vocabulary, such as “total loans,” “category,” “lowest,” and “increased,” so the topic is generally understandable. However, the range is limited and several word choices or collocations are awkward, including “compares below give information,” “has the most number of loans,” and “is eligible same.” There are also spelling errors in “memberes” and “finction,” and inconsistent capitalisation of “Little Chalfont.” These issues make parts of the report difficult to read precisely. Build a more accurate set of trend and comparison phrases, such as “accounted for,” “peaked at,” and “was slightly higher than,” and check spelling and word forms before submitting.
Grammatical Range and Accuracy: Band 5.0
You attempt both simple and longer sentences, but control is inconsistent, and errors sometimes make relationships between ideas unclear. For example, “The adults has the most 18-64 to 51%” has problems with agreement and sentence construction, while “In 2016 has the most number of loans” lacks a clear subject. The sentence beginning “Overall” also joins several ideas without clear grammatical links. Most sentences rely on basic patterns, with limited accurate use of complex structures. Practise forming complete comparisons with a clear subject and verb—for example, “Adults aged 18–64 made up 51% of members”—and use consistent past-tense forms when describing the 2007–2016 data.
See this exact question answered at other band scores. The same prompt compared across bands.
Browse more IELTS Writing model answers or get your own writing scored by the same AI examiner.