Band 6.0 IELTS Writing Task 1 Model Answer
Overall Band Score: 6.0 · Cambridge IELTS 20 · 2026-11-14
IELTS Writing Task 1 question
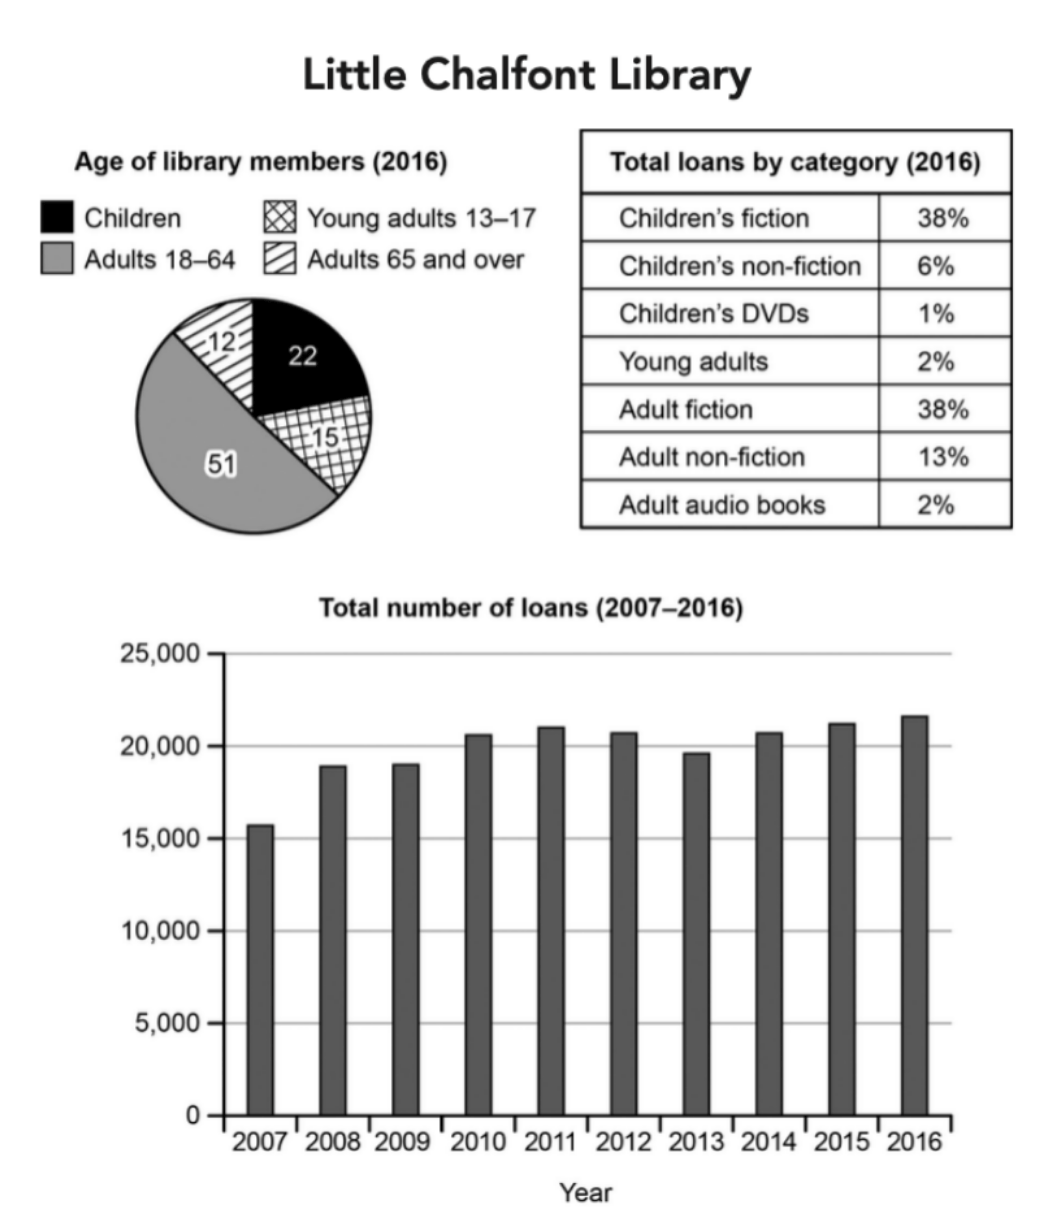
The charts below give information about a public library in a town called Little Chalfont.
Summarise the information by selecting and reporting the main features, and make comparisons where relevant.
Student answer (Band 6.0)
The charts illustrate information about a open library in a town called Little Chalfont.
Overall, In pie chart adults accounted for 51% of share which is the highest among all age groups, While adults 65 and above made up of lowest percentage of 12. The table shows total number of loan by category, the children's fiction and adults fiction had the highest share of 38% respectively. In bar graph the proportion increased steadily with slight fluctuations, the total number of loans is lowest in 2007, Whereas, highest in 2016 .
In pie chart, adults had the highest proportion of 51, followed by child that made up of 22%. Young adults made up of 15%, while adults 65 and above made up of 12%. In Table total loans by category had shown by year 2016. the children's fiction and adults fiction had the highest share of 38% respectively, Whereas, childern's DVDs comprized of lowest 1%.
In bar graph, In year 2007 the loan is at lowest of 16000, while it is highest in 2016 where total loan is 22000. while from 2008 to 2015 it increased with moderate fluctuations.
AI examiner evaluation
| Criterion | Band |
|---|---|
| Task Achievement / Task Response | 6.5 |
| Coherence and Cohesion | 6.0 |
| Lexical Resource | 5.5 |
| Grammatical Range and Accuracy | 5.0 |
| Overall | 6.0 |
Task Achievement / Task Response: Band 6.5
You cover all three visuals and identify several key features: adults aged 18–64 are the largest membership group, fiction leads the loan categories, and total loans peak in 2016. The category figures are reported accurately, and the overall trend is broadly described. This meets the task well, with some features already selected and compared effectively. However, the overview could be more precise: loans did not increase steadily, since they rose to 2011, fell, and then recovered. The 2007 figure is also given as 16,000 rather than approximately 15,700. To strengthen the response further, describe the main phases of the trend and include a clearer comparison of the smaller loan categories, rather than focusing mainly on the highest and lowest values.
Coherence and Cohesion: Band 6.0
The response has a recognisable structure, with an overview followed by details about the membership chart, category table and loan trend. This makes the information generally easy to follow. However, the organisation is weakened by repetition: the overview and the second paragraph both state that children’s and adults’ fiction each account for 38%, and the age-group figures are also repeated. Linking words such as “while” and “whereas” help signal comparisons, but their use is sometimes mechanical or awkward, and capitalisation after full stops is inconsistent. A more effective progression would be to give the overview once, then use separate detail paragraphs to compare the age groups and loan categories before describing the trend’s rise, dip and recovery.
Lexical Resource: Band 5.5
You use relevant vocabulary for describing charts, including “accounted for,” “highest proportion,” “share,” “fluctuations” and “total loans.” This gives you enough range to communicate the main information. However, several word choices and collocations are inaccurate or repetitive, such as “open library,” “made up of lowest percentage,” “loan is at lowest,” and “proportion increased steadily.” The spelling errors “childern’s” and “comprized” also reduce precision. Try to use standard chart language consistently, for example “library,” “the smallest share,” and “the number of loans reached its lowest point.” More precise verbs for changes would help distinguish a rise, a fall and a recovery.
Grammatical Range and Accuracy: Band 5.0
You attempt both simple and more complex sentences, including comparisons joined with “while” and “whereas,” and the main message is usually understandable. However, grammatical control is uneven, with errors in articles, sentence boundaries, agreement and clause construction. Examples include “a open library,” “adults 65 and above made up of lowest percentage,” and the fragment-like construction “In Table total loans by category had shown by year 2016.” Capital letters are also used inconsistently after full stops, as in “Overall, In pie chart.” Some sentences combine several ideas without clear punctuation. Practise forming complete comparison sentences and checking articles and verb forms; for example, “The table shows the proportions of loans in 2016” is clearer and grammatically complete.
See this exact question answered at other band scores. The same prompt compared across bands.
Browse more IELTS Writing model answers or get your own writing scored by the same AI examiner.