Band 5.0 IELTS Writing Task 1 Model Answer
Overall Band Score: 5.0 · Cambridge IELTS 20 · 2026-11-14
IELTS Writing Task 1 question
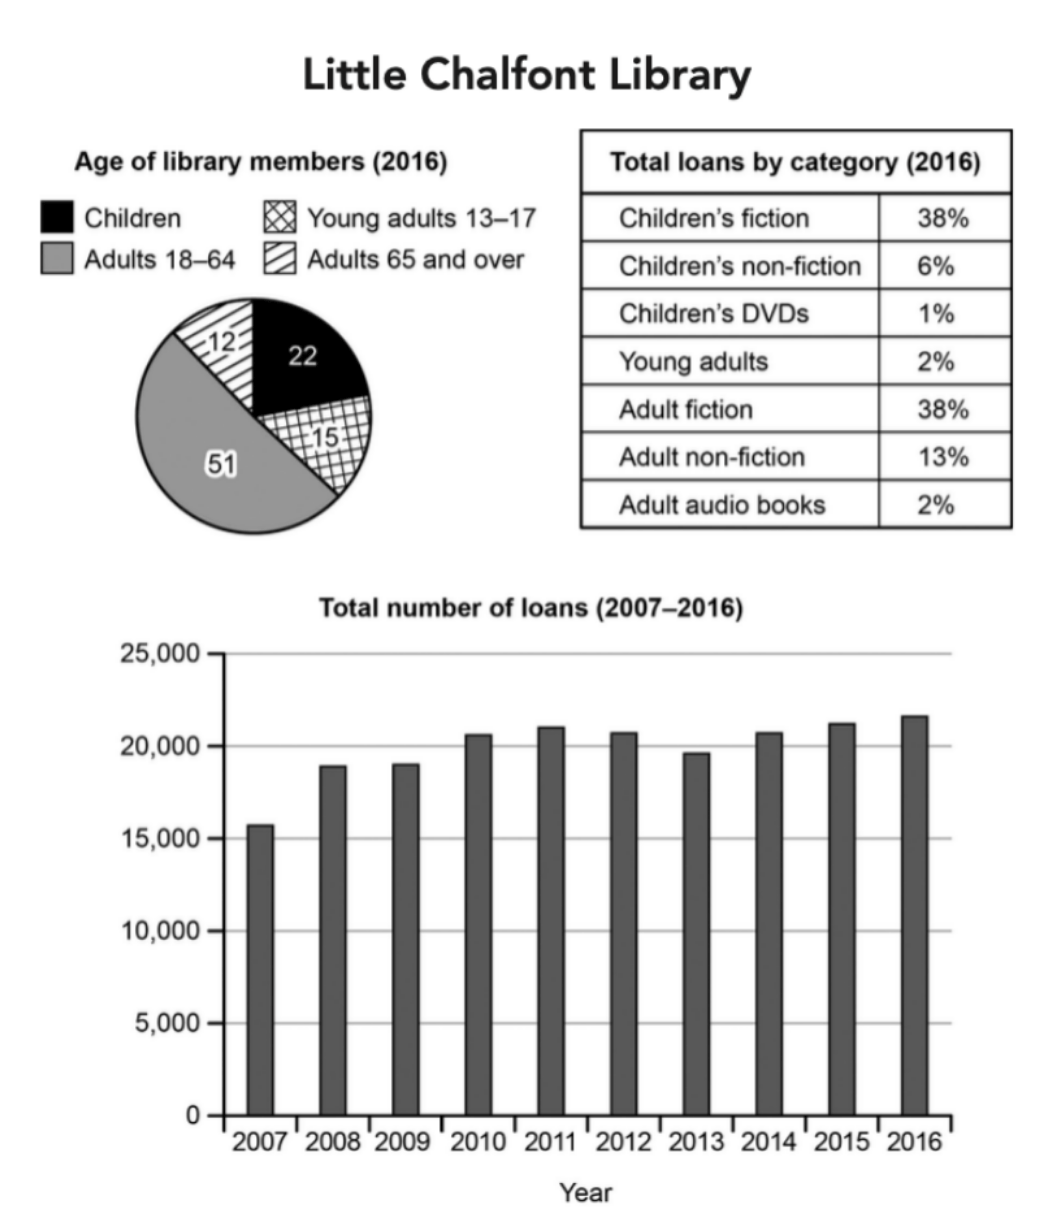
The charts below give information about a public library in a town called Little Chalfont.
Summarise the information by selecting and reporting the main features, and make comparisons where relevant.
Student answer (Band 5.0)
The table and graph illustrates the information regarding classification of loan that taken by the different ages of libray members over the period between 2007 to 2016.
Overall, it is quite evident that the most noteworthy thing ii the graph shows equalent increase of loan. While the most noteable thing is the less taken of loan during 2007.
Looking more closely into the layout, It was reveal that there is a range of libray member and adults are more in number. And adults with higher age were lower in percentage. consequently, in the table loan taken by adult fiction have greater fluctuation as compared to other categories.
Furthur, the amount of loan fluctuate during the period. However, there is no gradually increase or decrease of loan over that period. The graph explains that the no of people were the at equal rate. Eventually, in the table the children related books are less in number as compared with the adults in all types of catogories.
AI examiner evaluation
| Criterion | Band |
|---|---|
| Task Achievement / Task Response | 5.0 |
| Coherence and Cohesion | 5.0 |
| Lexical Resource | 5.0 |
| Grammatical Range and Accuracy | 5.0 |
| Overall | 5.0 |
Task Achievement / Task Response: Band 5.0
You identify several relevant features, including that adults form the largest membership group and that loans were lowest in 2007. However, the response only partially summarises the charts: it does not report the key proportions for membership or loan categories, and the claim that adult fiction showed “greater fluctuation” is not supported by the table, which gives category shares rather than changes over time. The overview that loans increased “equally” is unclear; the graph instead shows an overall rise from about 15,700 to 21,700, with fluctuations in between. To strengthen the response, select and accurately compare the main figures from all three visuals, especially the two 38% fiction categories and the dominance of adults aged 18–64.
Coherence and Cohesion: Band 5.0
The response has four paragraphs and uses basic signposting such as “Overall,” “Looking more closely,” and “Further,” so there is an attempt to organise the report. However, the progression between the charts is not consistently clear: the second body paragraph moves from membership figures to a claim about adult-fiction fluctuation, while the final paragraph shifts between the line graph and category shares. Some linking expressions, including “consequently” and “Eventually,” do not show a clear logical relationship. Several statements are also difficult to follow, such as “the graph explains that the no of people were the at equal rate.” Grouping each visual’s key information and using direct comparisons would create a clearer overall progression and make the connections between ideas more reliable.
Lexical Resource: Band 5.0
You use some task-related vocabulary, including “members,” “percentage,” “categories,” and “fluctuate,” and you attempt more formal reporting phrases such as “Looking more closely.” However, the range is limited and several word choices or collocations make the meaning unclear: “classification of loan,” “equalent increase of loan,” and “less taken of loan” are not natural descriptions of the data. Spelling errors such as “libray,” “noteable,” “Furthur,” and “catogories” are noticeable. Use precise chart language and accurate forms, for example, “loan categories,” “an overall increase,” and “the lowest number of loans.” This would make the report easier to understand and more appropriately academic.
Grammatical Range and Accuracy: Band 5.0
You attempt a mixture of simple and complex sentences, including a contrast beginning “While” and a sentence starting “However.” However, errors are frequent, and some sentences are difficult to interpret. For example, “The table and graph illustrates” has subject–verb disagreement, while “it was reveal” uses an incorrect verb form. The sentence “there is no gradually increase or decrease” also has problems with the article, word form, and sentence structure. Capitalisation and punctuation are inconsistent, as in “Looking more closely into the layout, It was reveal.” Practise accurate subject–verb agreement, past-tense reporting forms, and complete sentence patterns; then check each sentence for a clear subject and verb before submitting.
See this exact question answered at other band scores. The same prompt compared across bands.
Browse more IELTS Writing model answers or get your own writing scored by the same AI examiner.