Band 4.0 IELTS Writing Task 1 Model Answer
Overall Band Score: 4.0 · Cambridge IELTS 20 · 2026-11-15
IELTS Writing Task 1 question
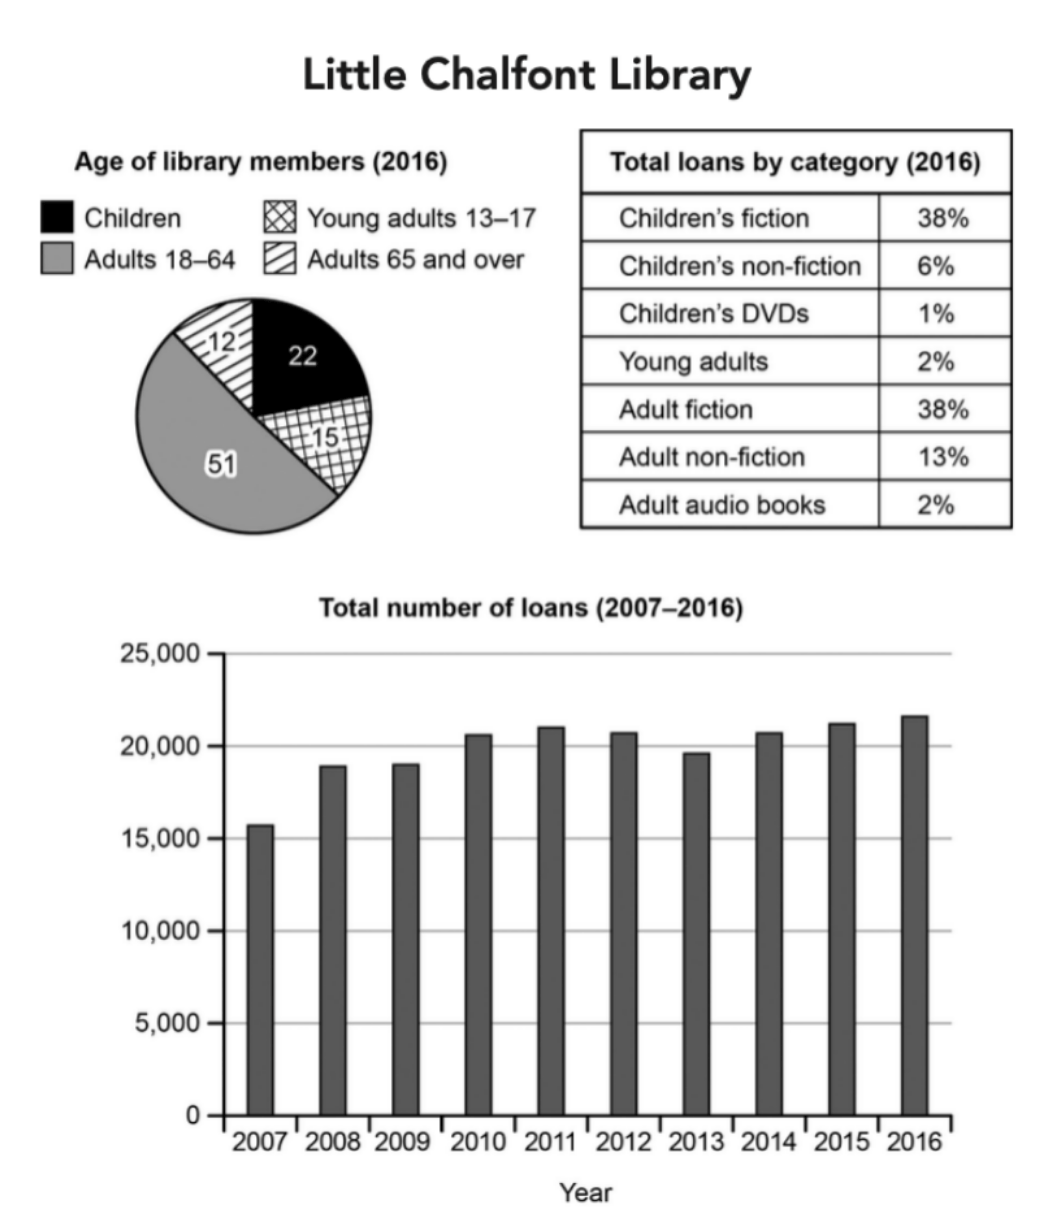
The charts below give information about a public library in a town called Little Chalfont.
Summarise the information by selecting and reporting the main features, and make comparisons where relevant.
Student answer (Band 4.0)
The given bar chart demonstrates the age of library members which is divided into four different categories: Children,young adults 13-17,adults 18-64,adults 65 and over.
Overall it is evident that adults between 18-64 is the highest member whereas adults aged 13-17 is the lowest member .
In the initial stage
AI examiner evaluation
| Criterion | Band |
|---|---|
| Task Achievement / Task Response | 3.0 |
| Coherence and Cohesion | 4.0 |
| Lexical Resource | 4.5 |
| Grammatical Range and Accuracy | 4.5 |
| Overall | 4.0 |
Task Achievement / Task Response: Band 3.0
You identify the chart’s subject and make one relevant comparison: adults aged 18–64 form the largest membership group. However, the response does not summarise the full set of visuals. It omits the loan-category figures and the trend in total loans from 2007 to 2016, and the overview is incomplete. The claim that adults aged 13–17 are the smallest group is inaccurate: members aged 65 and over are the smallest group, at 12%, compared with 15% for young adults. The unfinished phrase “In the initial stage” adds no information. The response is also 101 words below the required minimum. To improve, report the main features across all three visuals, support comparisons with accurate figures, and complete the summary.
Coherence and Cohesion: Band 4.0
There is a basic attempt to organise the response: the opening identifies the subject, followed by an overall statement. This gives the reader a simple starting point, but the response stops before developing a logical account of the charts. The standalone phrase “In the initial stage” is unfinished and does not connect to any data, so it interrupts rather than advances the progression. There are no developed paragraphs or linking expressions to guide comparisons between membership, loan categories and the yearly trend. Plan a short introduction, an overview, and detail paragraphs grouped by chart or related features; use clear links such as “By contrast” or “Meanwhile” only where they express a real relationship.
Lexical Resource: Band 4.5
The response uses some relevant chart vocabulary, including “categories,” “members,” and “highest,” and the age ranges help identify the groups being compared. However, the range is very limited because the response is so short, and several phrases are imprecise or unnatural. “The highest member” and “the lowest member” refer awkwardly to people rather than proportions or groups; “largest share of members” and “smallest group” would be clearer. “Initial stage” is also unsuitable for describing a year in a chart. Use precise terms such as “accounted for,” “proportion,” “loan category,” and “rose” or “fluctuated” to describe the other visuals, while ensuring each term matches the data.
Grammatical Range and Accuracy: Band 4.5
You produce a couple of basic sentence forms, and the opening sentence communicates the chart’s general subject. However, the range is narrow, and control is uneven. In “adults between 18-64 is the highest member,” the plural subject “adults” does not agree with “is”; the age range also needs a clearer grammatical construction, such as “adults aged 18–64 make up the largest group.” The comparison sentence has extra spacing before “is,” and the final fragment, “In the initial stage,” is not a complete sentence. Practise accurate comparative sentences and complete clauses, then vary structures to report figures and trends. Careful proofreading for agreement, punctuation and sentence completion would make the information easier to follow.
See this exact question answered at other band scores. The same prompt compared across bands.
Browse more IELTS Writing model answers or get your own writing scored by the same AI examiner.