Band 7.0 IELTS Writing Task 1 Model Answer
Overall Band Score: 7.0 · Cambridge IELTS 20 · 2026-11-15
IELTS Writing Task 1 question
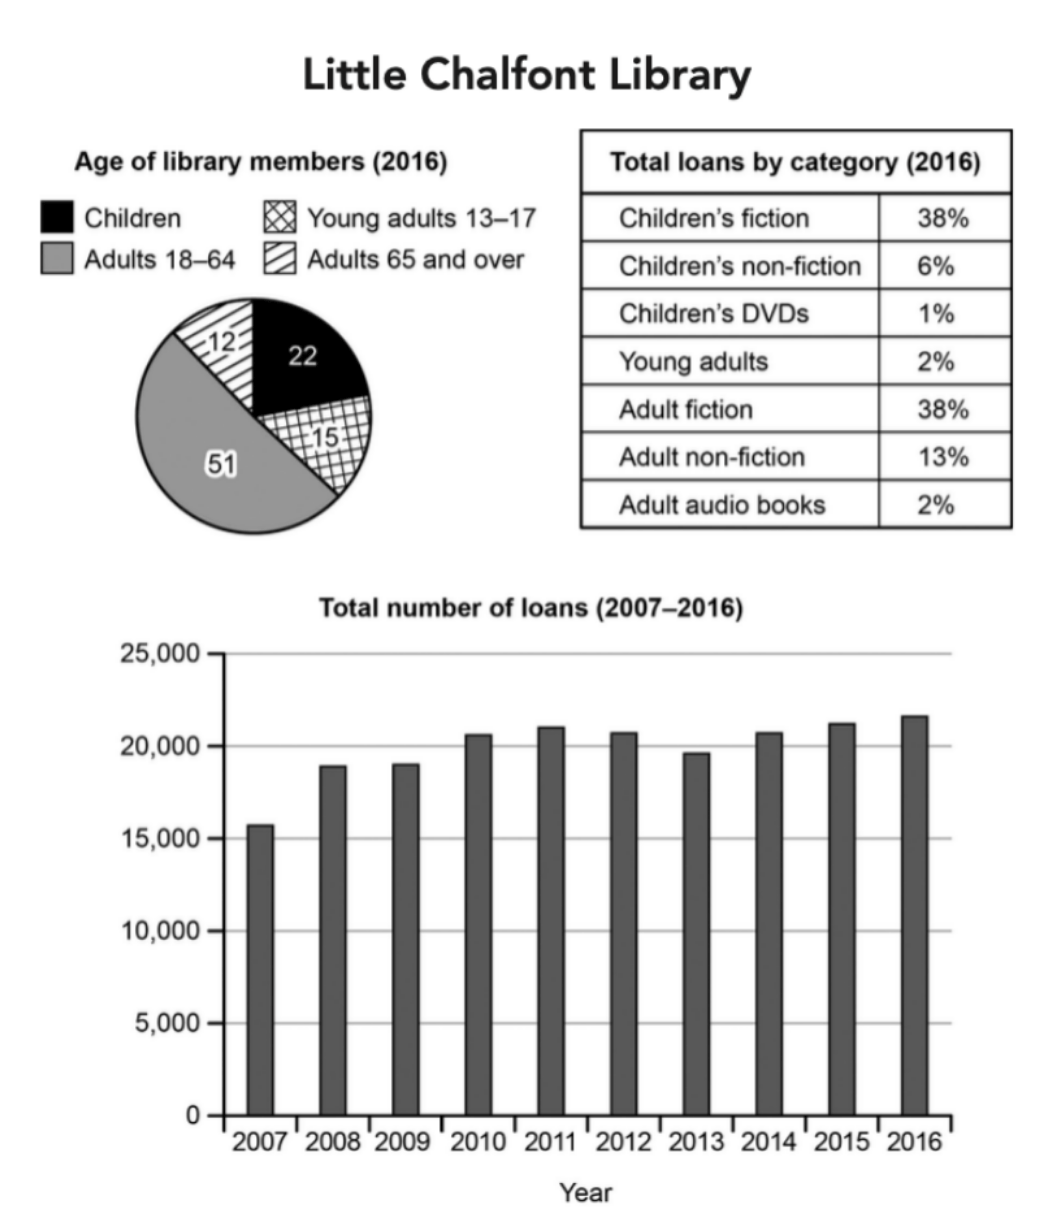
The charts below give information about a public library in a town called Little Chalfont.
Summarise the information by selecting and reporting the main features, and make comparisons where relevant.
Student answer (Band 7.0)
The pie chart below represents the age demographic of library members in Little Chalfont Library.The table summarizes total loans for each category while the bar chart illustrates total number of loans from 2007 to 2016 .
Overall, it is observed that adults constitute more than half of the library members.The bar chart shows fluctuations in loans each year .Fictional categories in both children and adults contribute to the highest loans.
The bar chart shows an increasing trend, reaching its peak in 2011 (20,000), followed by a decline in the next 2 years. But this was not permanent as the figures showed a marked increase in the following years attaining its peak just above 20,000.
Regarding the age of library members, adult members accounted for 51 % , followed by children at 22%. Both younger adults and adults over 65 represented lesser proportions,15% and 12% respectively. In terms of loans by category, both children and adults fiction contributed significantly to total loans with 38% each.This was followed by adult non- fiction at 13%. Other categories made up lesser proportions such as adult audio books (2%), Children's non-fiction (6%)and Children's DVDs(1%)
AI examiner evaluation
| Criterion | Band |
|---|---|
| Task Achievement / Task Response | 7.5 |
| Coherence and Cohesion | 7.0 |
| Lexical Resource | 7.0 |
| Grammatical Range and Accuracy | 6.5 |
| Overall | 7.0 |
Task Achievement / Task Response: Band 7.5
The response covers all three visuals and identifies the main patterns: adults form the largest membership group, fiction leads the loan categories, and annual loans rise overall despite fluctuations. The age and category percentages are reported accurately. However, the trend description contains a notable factual error: loans peak in 2016 at about 21,700, not in 2011 at 20,000; 2011 is around 21,000. The overview also says only that loans fluctuate, without clearly stating the overall rise from 15,700 in 2007 to 21,700 in 2016. These points keep the summary from being consistently precise, although the key features are selected and generally supported with figures. Make the overview more exact and check the chart values before reporting them.
Coherence and Cohesion: Band 7.0
The response has a clear overall structure: an introduction, an overview, and paragraphs describing the trend and the two sets of percentages. Its progression is easy to follow, and phrases such as “Regarding the age” and “In terms of loans by category” help signal shifts between visuals. Some linking is less effective: “But this was not permanent” is conversational and does not specify the change as clearly as a direct contrast would. The trend paragraph also moves from the 2011 peak claim to later years without giving a clear sequence of the main figures. Improve cohesion by using precise time references and linking the rise, dip, and recovery explicitly; consistent spacing after full stops would also make the presentation smoother.
Lexical Resource: Band 7.0
There is a suitable range of vocabulary for describing charts, including “age demographic,” “accounted for,” “contribute significantly,” “fluctuations,” and “attaining its peak.” These choices allow the writer to compare groups and describe movement without excessive repetition. Some expressions are imprecise or not fully natural in this context: “the age demographic” is less direct than “age distribution,” and “fictional categories” can suggest imaginary categories rather than fiction books. “Lesser proportions” is also less idiomatic than “smaller proportions.” The response shows enough flexibility for the task, but more accurate collocations and consistent terminology would make the descriptions more precise. Prefer concise chart language such as “share,” “loan total,” and “rose to” where appropriate.
Grammatical Range and Accuracy: Band 6.5
The response uses a mix of simple and more complex structures, including the overview sentence beginning “Overall” and the contrast in “But this was not permanent as the figures showed…”. Most meanings remain clear, but grammatical control is uneven. There are missing spaces after full stops in “Library.The” and “year .Fictional,” and punctuation around percentages is inconsistent, as in “51 % ,” and “38% each.This.” The phrase “followed by a decline in the next 2 years” is understandable, though the sentence would be clearer with a more controlled time construction. The writer is beginning to use varied sentence forms, but careful proofreading of punctuation and sentence boundaries, alongside more consistently accurate structures, is needed for stronger control.
See this exact question answered at other band scores. The same prompt compared across bands.
Browse more IELTS Writing model answers or get your own writing scored by the same AI examiner.