Band 5.5 IELTS Writing Task 1 Model Answer
Overall Band Score: 5.5 · Cambridge IELTS 20 · 2026-11-16
IELTS Writing Task 1 question
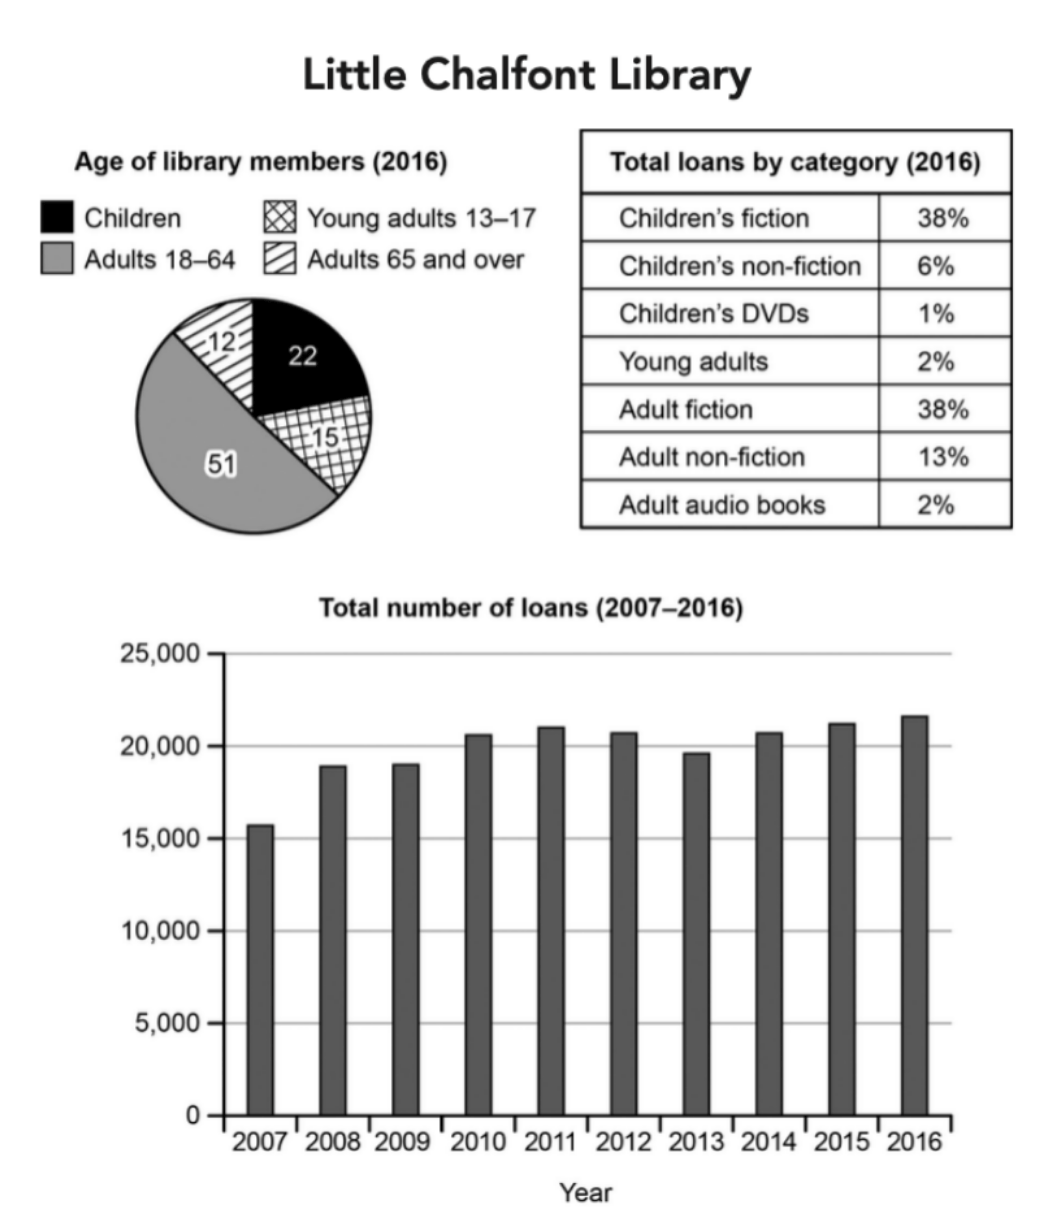
The charts below give information about a public library in a town called Little Chalfont.
Summarise the information by selecting and reporting the main features, and make comparisons where relevant.
Student answer (Band 5.5)
The pie chart illustrates proportion about age of library members in 2016 and table give information about total loans by category in percentage however line graph shows total number of loans in 2007 to 2016.
overall,half of library memebers are adults which is highest however lowest are adults above 64 years meanwhile children's fiction and adult fiction category are highest share in loan on the other hand children's DVDs are lowest and total no of loans in 2016 is peak and in 2007 is lowest.
total number of loans in 2007 is lowest about 15,000 but it incresed stedily in 4 years 2011 about 21,000 before decline in 2012 and 2013 below 20,000 after that it rose steadily 22,000 which is peak and the children's fiction and adult fiction types are more loan about 38% each meanwhile children's DVDS is lowest share about 1% in 2016.
in contrast, the highest proportion of library memebers in 2016 was adults age from 18-64 about 51% followed by children about 22% and lowest are adults above 64 years about 12%.
AI examiner evaluation
| Criterion | Band |
|---|---|
| Task Achievement / Task Response | 6.5 |
| Coherence and Cohesion | 5.5 |
| Lexical Resource | 5.5 |
| Grammatical Range and Accuracy | 5.0 |
| Overall | 5.5 |
Task Achievement / Task Response: Band 6.5
You cover all three visuals and identify several important features: adults aged 18–64 form the largest membership group, the two fiction categories each account for 38% of loans, and loans are lowest at the start of the period and highest in 2016. The trend description is broadly accurate, including the rise to 2011, the subsequent dip, and the later recovery. This gives the report a relevant overview and supports the main comparisons. However, the membership figures are incomplete: children are reported as 22%, but the 15% share for young adults is omitted. The overview also says loans rose to 22,000, whereas the chart indicates approximately 21,700. More precise reporting and fuller coverage of the age groups would make the summary more complete.
Coherence and Cohesion: Band 5.5
The response has an identifiable introduction, overview and supporting details, and it moves between the charts in a generally understandable way. However, the progression is not consistently clear: the second paragraph combines the loan trend with category shares, while the final paragraph returns to membership figures already mentioned in the overview. This creates some repetition and makes the organisation feel less deliberate. Linking expressions such as “however,” “meanwhile” and “in contrast” are used, but some do not show a clear contrast between the ideas they connect. Group the membership data together, then the loan categories, and describe the time trend in its own paragraph. This would create clearer progression and reduce reliance on repeated connectors.
Lexical Resource: Band 5.5
You use relevant task vocabulary, including “proportion,” “category,” “decline,” “share” and “steadily,” so the reader can understand the main comparisons and trends. However, the range is limited and several word-choice or spelling problems reduce precision, such as “proportion about age,” “more loan,” “memebers” and “incresed.” Some expressions are also unnatural for describing charts; for example, “total no of loans … is peak” would be clearer as “the total number of loans peaked.” Aim for accurate collocations and consistent formal wording, rather than abbreviations such as “no.” Proofreading spelling and choosing standard phrases for proportions, membership groups and loan totals would make the vocabulary more controlled and natural.
Grammatical Range and Accuracy: Band 5.0
You attempt both simple and more extended sentences, and the main information is usually understandable. However, control is uneven, particularly in longer sentences that join several comparisons with “however,” “meanwhile” and “before.” For example, “the pie chart illustrates proportion about age of library members … and table give information” has missing articles and incorrect subject–verb agreement. There are also errors in plural and verb forms, as in “the highest proportion … was adults” and “it incresed … before decline.” Capitalisation and punctuation are inconsistent, including the lowercase opening “overall” and missing spaces after commas. Use shorter, clearly punctuated sentences where needed, and check articles, agreement and verb forms when revising.
See this exact question answered at other band scores. The same prompt compared across bands.
Browse more IELTS Writing model answers or get your own writing scored by the same AI examiner.