Band 5.5 IELTS Writing Task 1 Model Answer
Overall Band Score: 5.5 · Cambridge IELTS 20 · 2026-11-16
IELTS Writing Task 1 question
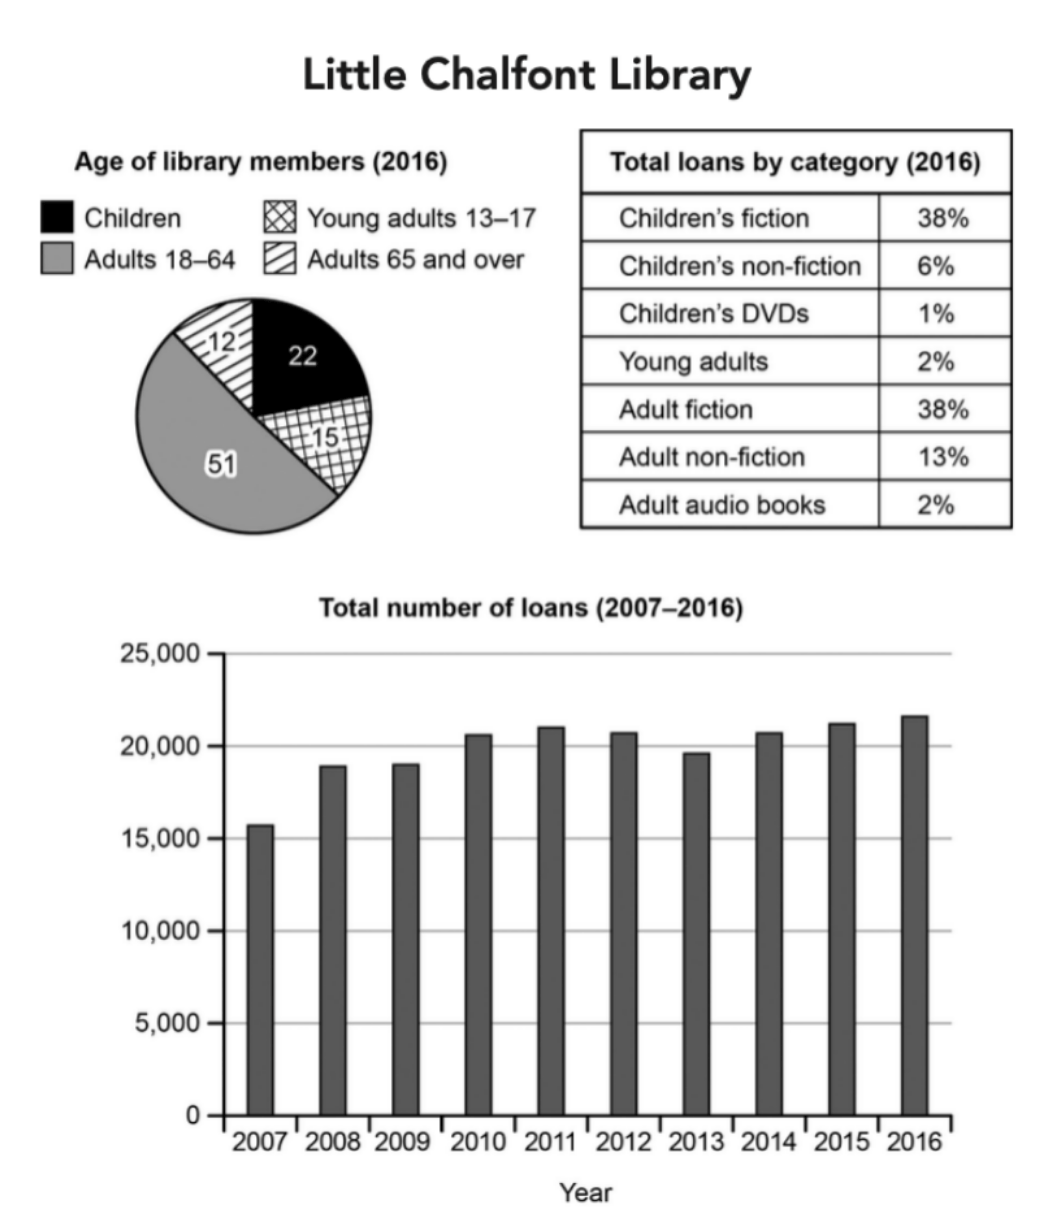
The charts below give information about a public library in a town called Little Chalfont.
Summarise the information by selecting and reporting the main features, and make comparisons where relevant.
Student answer (Band 5.5)
the bar shard shows the total number of loans in Lilttle Chalfont Library between 2007 and 2016 while the pie bar gives the age of library members in 2016.
Overall,the numbers grew throughout the years,espacially in 2016.
According to the bar shard , the little chalfont library received around 15000 loans in 2007,and the number of loans kept getting higher almost 20000 in 2008 and 2009 and over 20000 in 2010,2011 and 2012,but the numbers decreased a little bit in 2013 to be less than 20000 and the rest of the years which are 2014,2015 and 2016 the numbers starts to grew up year after year to surpass 20000 loans.
Based on the pie shard , the adults that their ages are between 18 and 64 got the higher percentage by 51% of members composed of 3 main sections adult's fiction with 38%, adult's non-fiction with 13% and adult's audio books with 2% , while the children which are below 13 came as second with 22%, 38% of them are for children's fiction, 6% for children's non-fiction and 1% for children's DVD,the young adults between 13 and 17 got 15% with 2% of them for Young adults and the rest are adults with the ages 65 and over with 12% of the library members.
AI examiner evaluation
| Criterion | Band |
|---|---|
| Task Achievement / Task Response | 5.5 |
| Coherence and Cohesion | 6.0 |
| Lexical Resource | 5.0 |
| Grammatical Range and Accuracy | 5.0 |
| Overall | 5.5 |
Task Achievement / Task Response: Band 5.5
You identify the main subject of the charts and report several relevant figures, including the rise in loans from about 15,700 in 2007 to 21,700 in 2016 and the 51% share of members aged 18–64. However, the overview is incomplete and partly inaccurate: loans did not grow throughout the period, since they fell after 2011 and again in 2013; the final increase is the clearest trend. The description of the membership and loan categories also confuses two different charts. For example, 38% is the share of all loans that were adult fiction, not a proportion of adult members. To develop the response further, distinguish membership percentages from loan-category percentages and summarise the key comparisons accurately.
Coherence and Cohesion: Band 6.0
The response has a recognisable overall structure: an introduction, an overview, and separate descriptions of the loan trend and the age/category information. This gives the reader a basic route through the material. Some connections are nevertheless unclear or mechanical. The long paragraph beginning “Based on the pie…” combines membership figures with loan-category figures, making it difficult to follow which chart each number describes. The phrase “the rest of the years” also groups several years without clearly showing the changes between them. Use separate paragraphs for the line graph, membership chart, and loan categories, and use precise references such as “the proportion of members” and “the share of loans” to make relationships clearer.
Lexical Resource: Band 5.0
You use some relevant chart vocabulary, including “total number of loans,” “percentage,” “decreased,” and “surpass,” so the topic is generally understandable. However, the range is limited and several word choices or spelling errors reduce precision. “Bar shard” and “pie shard” are repeated and appear to mean “bar chart” and “pie chart”; “grew up” is not the natural expression for an increase in figures, and “got the higher percentage” is awkward. There are also spelling slips such as “Lilttle” and “espacially.” Build a more accurate set of trend and comparison expressions, and check spelling and collocations carefully. This would make the report clearer and more appropriate to an academic summary.
Grammatical Range and Accuracy: Band 5.0
You attempt both simple and extended sentences, and the sequence of years is mostly conveyed through past-tense verbs. However, complex sentences are often difficult to control, particularly in the final paragraph: “the adults that their ages are between 18 and 64 got the higher percentage” has an unclear relative clause and faulty sentence structure. There are also errors in agreement and verb forms, as in “the numbers starts to grew up,” and punctuation is inconsistent, including missing spaces after commas and a comma after “Overall” without a following space. These problems sometimes make the relationships between figures hard to understand. Practise shorter, controlled comparisons first, then combine them using accurate clauses and consistent past-tense forms.
See this exact question answered at other band scores. The same prompt compared across bands.
Browse more IELTS Writing model answers or get your own writing scored by the same AI examiner.