Band 6.0 IELTS Writing Task 1 Model Answer
Overall Band Score: 6.0 · Cambridge IELTS 20 · 2026-11-16
IELTS Writing Task 1 question
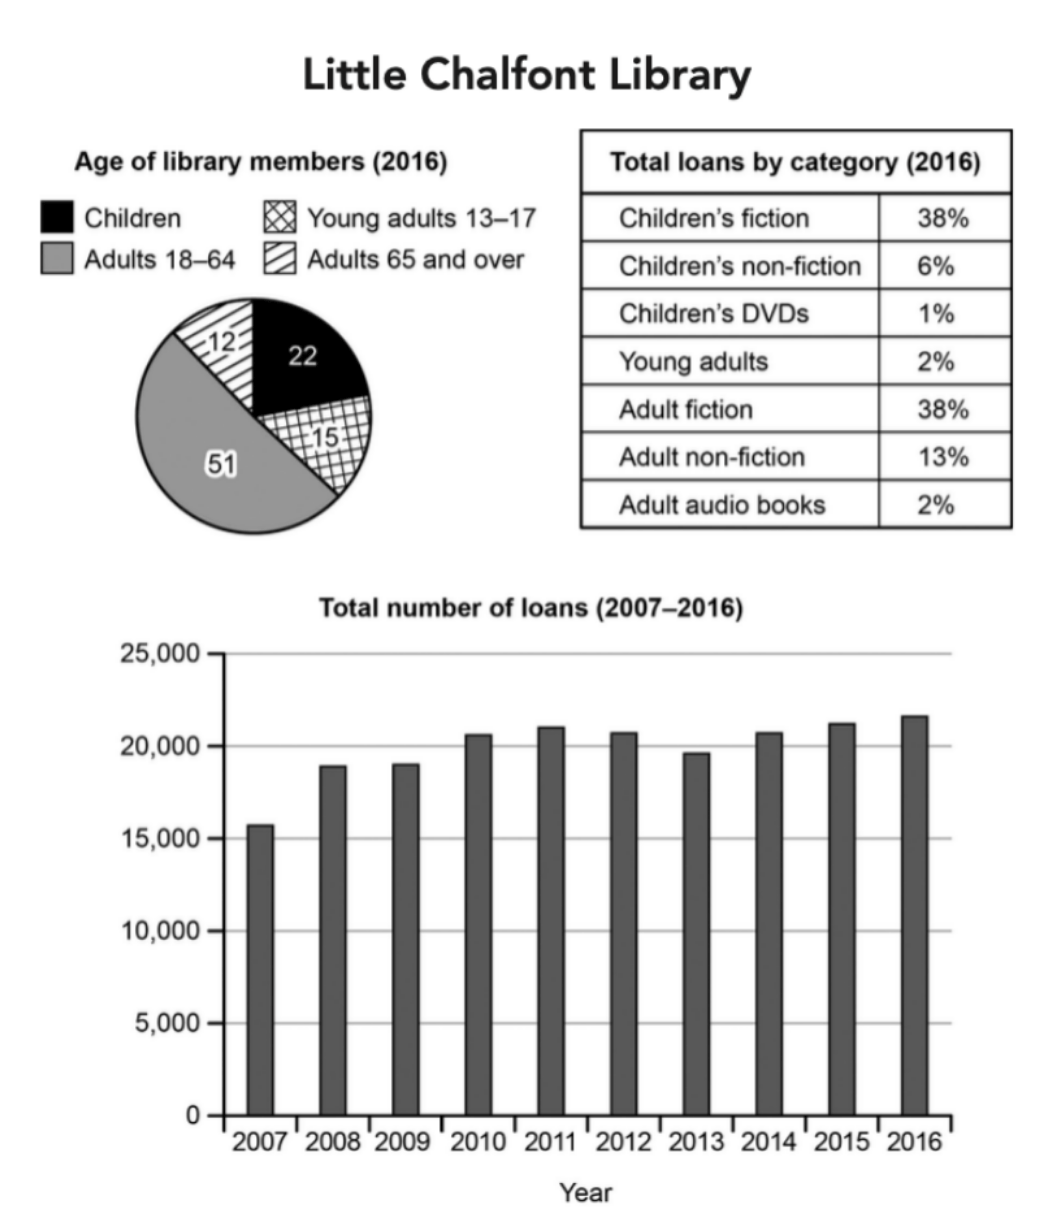
The charts below give information about a public library in a town called Little Chalfont.
Summarise the information by selecting and reporting the main features, and make comparisons where relevant.
Student answer (Band 6.0)
The pie chart represents the age of members in the Little Chalfont library in 2016 , while the table illustrates the total loans of the library by category in 2016.And finally The bar chart shows the total number of the library's loans for 9 years between 2007 and 2016.
Overall , in 2016 the adults aged between 18 and 64 are more popular in the library than the children , young adults and adults aged 65 and over. In the same period of time , children's fiction and adult fiction are far higher than the other categories , and the adult audio books , children's DVDs are both near the zero. For the bar chart and for 9 years , the total number of loans , started from 16,000 on 2007. However for other 8 years , it only showed some slight changes.
According to the pie chart , Adults are on the first place with a total of 51%. Yet the adults over 65 years old are rare.
Turning to the table of the total loans per categories , there is a high demand for the children's fiction and adult fiction with a total of 38% each ,besides the children's DVDs and adult audio books together , reached only 3%.
Moving to the bar chart , we can cut it to two parts. Starting with the part one , which is about the 2007 period , where the number of the loans is only 16,000. However , the second part of between 2008 and 2016 , the number of loans remained approximately the same , starting from 19,000 up to 22,000.
AI examiner evaluation
| Criterion | Band |
|---|---|
| Task Achievement / Task Response | 6.0 |
| Coherence and Cohesion | 6.0 |
| Lexical Resource | 6.0 |
| Grammatical Range and Accuracy | 5.5 |
| Overall | 6.0 |
Task Achievement / Task Response: Band 6.0
You cover all three visuals and identify several important features: adults aged 18–64 form the largest membership group, fiction accounts for the largest loan shares, and annual loans rise overall from about 16,000 to nearly 22,000. The figures for the two fiction categories and the small combined share of children’s DVDs and adult audiobooks are accurate. However, some comparisons are incomplete or imprecise. Calling adults over 65 “rare” does not give their 12% share, and the overview says loans showed “slight changes” without noting the overall increase or the peak in 2016. The description of the age groups also omits the children’s and young-adult figures. Include the main values and describe the trend more precisely to develop the report more fully.
Coherence and Cohesion: Band 6.0
The response has a clear overall arrangement: an introduction, an overview, and separate paragraphs for the membership, loan-category and annual-loan data. Phrases such as “Turning to” and “Moving to” help signal these shifts, and the reader can follow the main topics. However, some linking is mechanical or awkward, particularly “And finally” in the introduction and the repeated “However” when no clear contrast is being made. The overview also combines several points without a clear hierarchy, while the final paragraph’s division into “two parts” is not well explained and does not add much to the comparison. Organise the overview around the strongest contrasts and use more direct links between related figures.
Lexical Resource: Band 6.0
You use an adequate range of vocabulary for describing charts, including “represents,” “illustrates,” “demand,” “remained approximately the same” and “slight changes.” These choices make the subject clear, and terms such as “children’s fiction” and “adult audio books” are generally appropriate. Some word choices and collocations are less natural or imprecise: “more popular in the library” does not clearly mean the largest membership group, and “adults are on the first place” is not idiomatic. “Rare” is also too strong for a group that makes up 12%. Aim for precise chart language such as “accounted for,” “represented” and “the largest proportion,” and check collocations when describing rankings and shares.
Grammatical Range and Accuracy: Band 5.5
You attempt a mix of simple and more complex sentences, including clauses introduced by “while” and “where,” and most of the message remains understandable. Some grammatical and punctuation errors persist, however. There are missing spaces after full stops in “2016.And finally” and “2016 ,” and commas are often separated from the preceding word. The sentence “For the bar chart and for 9 years, the total number of loans, started…” has an unnecessary comma and an awkward structure; “the total number … started” also gives the chart’s figure an unclear subject. In “the children’s DVDs and adult audio books together, reached only 3%,” the subject-verb construction and comma are faulty. Use complete, direct sentences and check punctuation, articles and agreement.
See this exact question answered at other band scores. The same prompt compared across bands.
Browse more IELTS Writing model answers or get your own writing scored by the same AI examiner.