Band 5.5 IELTS Writing Task 1 Model Answer
Overall Band Score: 5.5 · Cambridge IELTS 20 · 2026-11-16
IELTS Writing Task 1 question
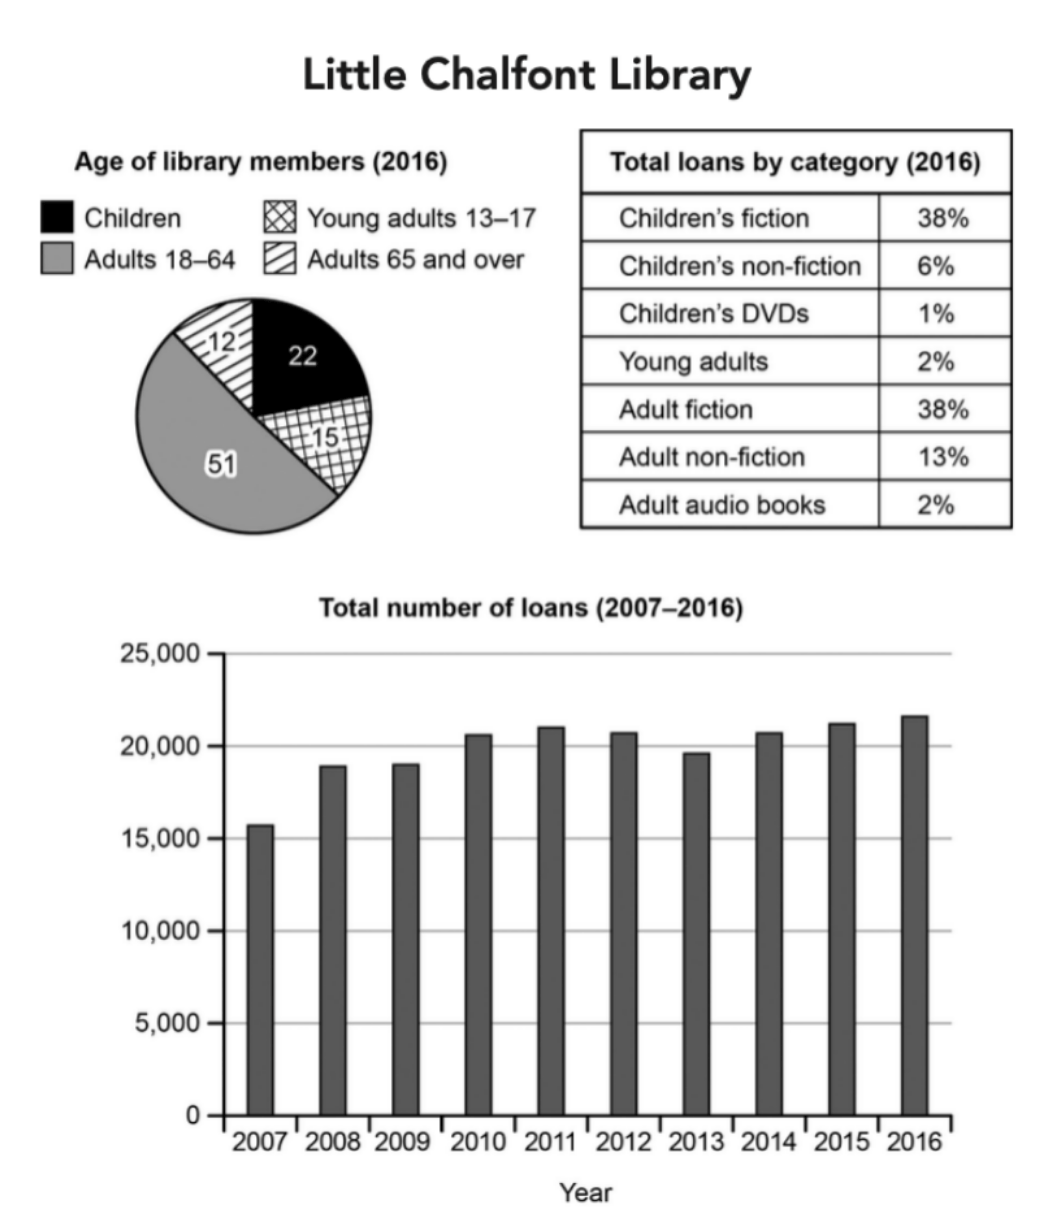
The charts below give information about a public library in a town called Little Chalfont.
Summarise the information by selecting and reporting the main features, and make comparisons where relevant.
Student answer (Band 5.5)
The pic chart illustrates the data Little chalfont libary defferent type age of mambers ,meanwhile the table and line graph below approximate loan category by defferent year .
Overall , We can see that , large amount adults are coming libraray , others totale loan lowest children .
Pic chart below 51 percentage adults age 18-64 it is a significant number member , while 12 percent adults thosew people are age 65 and over it lowest . second highest are children there parecentage 22 .
Now , looking the table and line graph , table show highest loan for children,s fictional book , loan amount 38 percent. and a notice able point same percentage loan for adults fiction book and less amount loan for childfen DVDS 1 percent .Meanwhile another line graph we can see , there highest loan amount around 22500 in the 2016 ,and a mention key there in 2010,2011and 2012 are same amount loan collect the library 21000.in 2007 it was 16000 but every year it incresing , but few time it down like 2013 was 19000.There lowest loan in the first year 2007 .
AI examiner evaluation
| Criterion | Band |
|---|---|
| Task Achievement / Task Response | 6.0 |
| Coherence and Cohesion | 6.0 |
| Lexical Resource | 5.0 |
| Grammatical Range and Accuracy | 5.0 |
| Overall | 5.5 |
Task Achievement / Task Response: Band 6.0
You cover all three visuals and identify several important features, including the largest membership group (adults aged 18–64), the equal 38% shares for children’s and adult fiction, and the overall rise in loans from the first year to the last. These are relevant comparisons and give the report a clear overview. However, some details are inaccurate or unclear: the membership figures are percentages, but the opening description calls them data about age without clearly stating this; the 2016 loan total is given as about 22,500 rather than approximately 21,700; and the claim that 2010–2012 had the same loan total is incorrect. The trend also fluctuates rather than increasing every year. More precise reporting of the graph and a fuller account of the category shares would make the coverage more complete.
Coherence and Cohesion: Band 6.0
The response has a recognisable overall structure: an introduction, an overview, and separate discussion of membership and loans. This helps the reader follow the main topics, and phrases such as “Overall” and “Now, looking at” signal transitions. However, the progression within the final paragraph is less controlled: the table and line graph are discussed together, and the account moves between category shares and yearly totals without a clear distinction. Some linking is mechanical or confusing, as in “Meanwhile another line graph,” while repeated “there” and “and” constructions make relationships between points harder to follow. Use one paragraph for the membership chart, one for loan categories, and one for the time trend, with clear comparisons and references.
Lexical Resource: Band 5.0
You use some task-relevant vocabulary, including “percentage,” “significant number,” “highest,” “lowest,” and “increasing,” so the reader can identify the intended comparisons. However, the range is limited and several word-choice, spelling, and collocation problems reduce precision: “pic chart,” “loan amount,” “coming libraray,” and “children,s fictional book” are either inaccurate or unnatural. Repetition of “amount” and “loan” also makes the report less flexible. Aim to use standard chart language and accurate category names, such as “pie chart,” “share of total loans,” and “children’s fiction.” Careful proofreading of spelling and apostrophes would also make the information easier to understand.
Grammatical Range and Accuracy: Band 5.0
You attempt both simple statements and longer sentences, and the reader can generally understand the main comparisons. However, control of sentence structure is uneven, particularly in longer sentences joined by commas or “and.” For example, “Pic chart below 51 percentage adults age 18-64 it is a significant number member” lacks a clear grammatical structure, while “in 2010,2011and 2012 are same amount loan collect the library 21000” has problems with word order and verb construction. Articles, plurals, and agreement are also inconsistent, as in “a significant number member” and “there highest loan amount.” Practise building complete sentences with a clear subject and verb, and use past-tense forms consistently when describing the 2007–2016 data.
See this exact question answered at other band scores. The same prompt compared across bands.
Browse more IELTS Writing model answers or get your own writing scored by the same AI examiner.