Band 4.0 IELTS Writing Task 1 Model Answer
Overall Band Score: 4.0 · Cambridge IELTS 20 · 2026-11-16
IELTS Writing Task 1 question
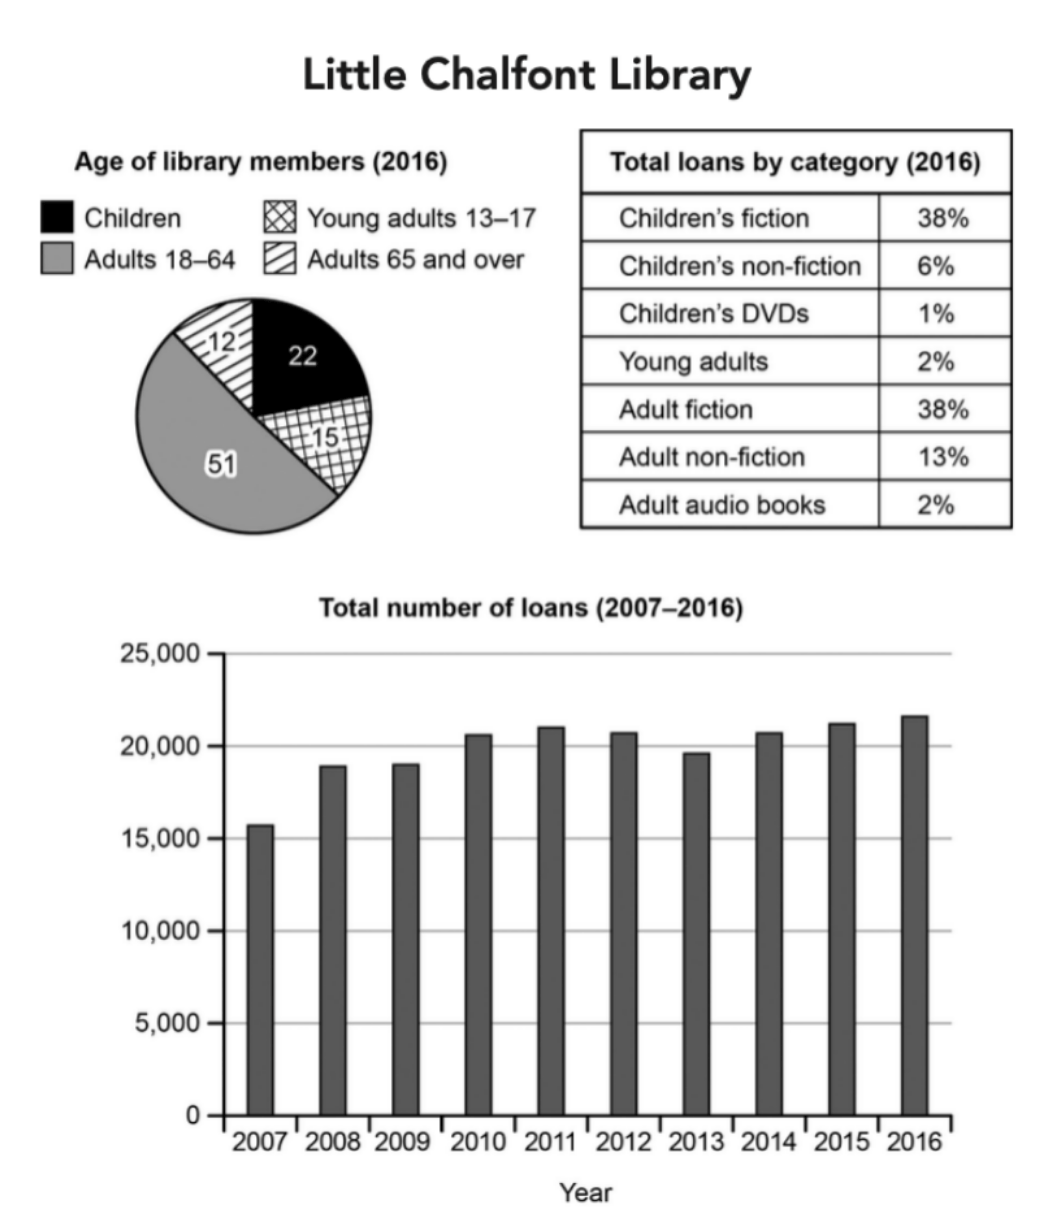
The charts below give information about a public library in a town called Little Chalfont.
Summarise the information by selecting and reporting the main features, and make comparisons where relevant.
Student answer (Band 4.0)
The pie chart illustrate the proportion of a public Little Chalfont library that is located in a town shows the total amount of loans from year 2007 to 2016.
The pie chart shows the library members of 2016 year. The value of adults have a larger section are the part of the library.
AI examiner evaluation
| Criterion | Band |
|---|---|
| Task Achievement / Task Response | 3.0 |
| Coherence and Cohesion | 4.0 |
| Lexical Resource | 4.5 |
| Grammatical Range and Accuracy | 4.5 |
| Overall | 4.0 |
Task Achievement / Task Response: Band 3.0
The response makes a limited attempt to describe the charts, but it does not adequately summarise the information or select the main features. It mentions the period from 2007 to 2016 and says adults form the largest section of library members, which broadly matches the data; however, it gives no figures and does not describe the loan trend, the category shares, or meaningful comparisons. The opening also confuses the charts, calling the library itself a pie-chart proportion. The response is substantially below the required 150 words, leaving too little space to cover the task. To improve, provide an overview of the main patterns, then report key figures from each visual and compare the largest and smallest groups.
Coherence and Cohesion: Band 4.0
There is a basic sequence: the first sentence refers to the loan chart, and the second turns to library membership. However, the response is only two sentences and does not develop a clear progression across the three visuals. The relationship between the opening and the next sentence is not explained, and there are no linking expressions to guide the reader through the information. The phrase “The value of adults” also makes the intended point less clear. Organise the report into a short introduction, an overview, and detail paragraphs grouped by chart; use simple links such as “By contrast” or “Meanwhile” where comparisons are relevant.
Lexical Resource: Band 4.5
The vocabulary is basic but includes some task-related terms, such as “pie chart,” “proportion,” “loans,” and “library members.” These show an attempt to describe visual data, but several choices are inaccurate or awkward: “the proportion of a public Little Chalfont library” suggests the library itself is being divided, while “the value of adults” is not a natural way to describe a membership share. “Larger section” communicates a general comparison but lacks precision. Build a more suitable range for chart reporting, including “accounted for,” “share,” “loan total,” and “the largest proportion,” and use the exact categories shown in the visuals.
Grammatical Range and Accuracy: Band 4.5
The response uses short, simple sentence patterns, and the basic meaning can be followed, but grammatical control is uneven. In “The pie chart illustrate,” the singular subject requires “illustrates.” The opening sentence also has a confusing structure: “that is located in a town shows” leaves the relationship between the library and the chart unclear. In “The value of adults have,” the subject and verb do not agree, and “of 2016 year” is not a well-formed time expression. These errors, together with the very limited range of sentence structures, restrict clarity. Practise accurate subject–verb agreement and use straightforward patterns such as “The chart shows…” followed by a clear comparison.
See this exact question answered at other band scores. The same prompt compared across bands.
Browse more IELTS Writing model answers or get your own writing scored by the same AI examiner.