Band 6.0 IELTS Writing Task 1 Model Answer
Overall Band Score: 6.0 · Cambridge IELTS 20 · 2026-11-17
IELTS Writing Task 1 question
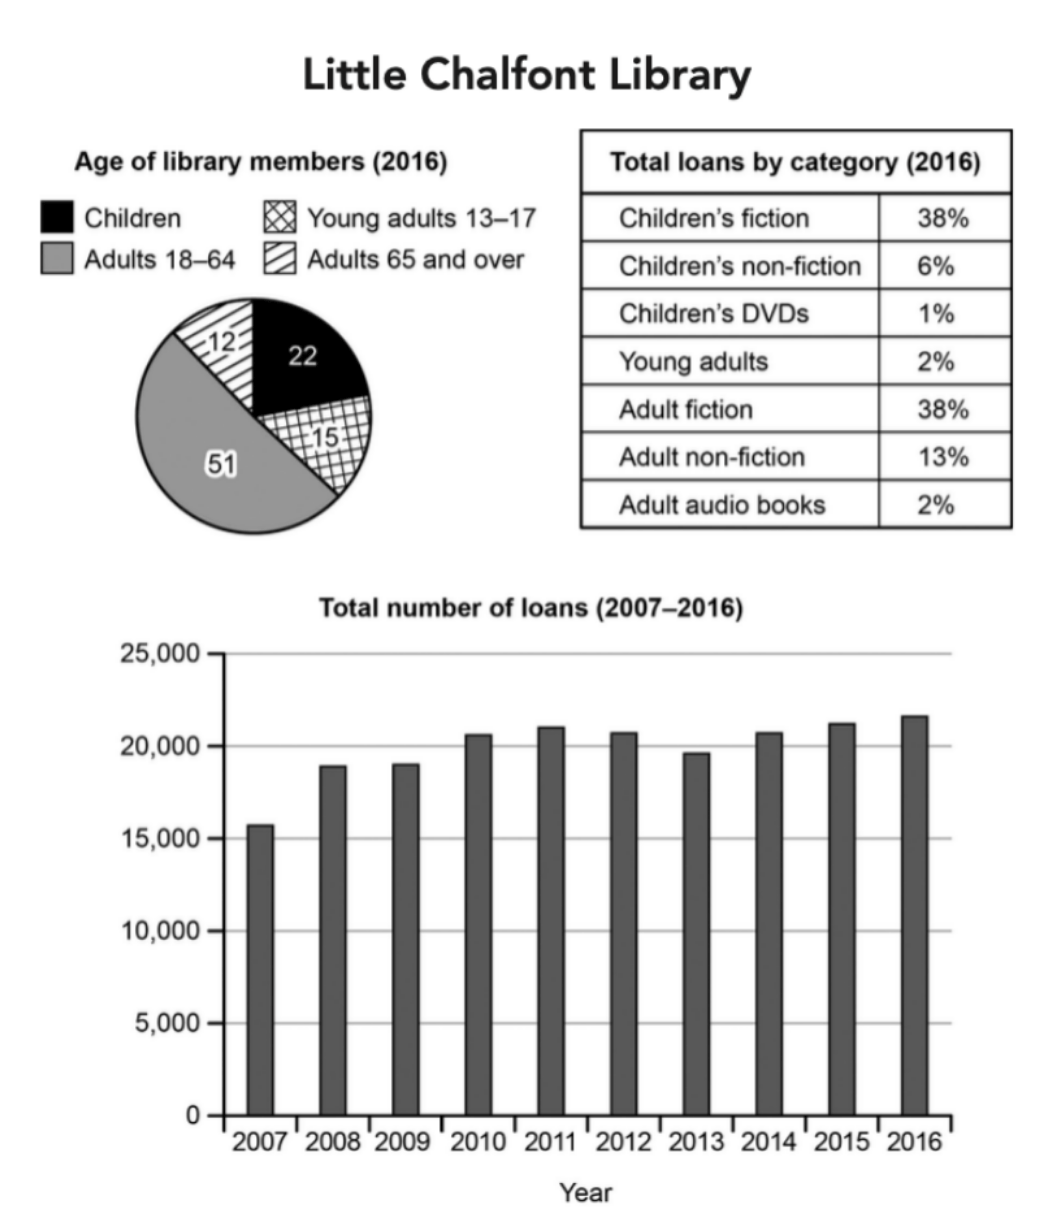
The charts below give information about a public library in a town called Little Chalfont.
Summarise the information by selecting and reporting the main features, and make comparisons where relevant.
Student answer (Band 6.0)
The pie chart illustrates diffrent age of library members in Little Chalfont in 2016. The table, on the other hand displays the total loans by cetegory. Furthermore, the bar chart compare total number of loans throughout the period 2007 and 2016.
Overall, Adults was the largest shares. In term of total loans children's fiction and adult fiction was the highest portion, conversely, children's DVDs recorded the lowest percentage. On the other hand, the total number of loans fluctuated over the given period.
Looking at the pie chart in more detail, adults made up the biggest number of library members at 51 members, it was followed with children, which represented 22 members. Young adults (13-17) represented 15 members following with Adults of 65 and more with 12 members.
Turning to the table, children's DVDs represent 1% of the total loans in 2016, it was followed with young adults and adult audio books with 2% for each. Children's non-fiction was at 6%, and adult non-fiction at 13%, ending with children's fiction and ault fiction which represent 38% for each one.
On the other hand, the bar graph compare total number of loans between 2007 and 2016, the total number fluctuate over the period, it stood at approximately 15,500 in 2007. This figure incresed steadly until 2011 where it reached equivalentlly 21,000. By 2013 in declined to around 19,000 before rising again to reach its peak in 2016 with around 24,000.
AI examiner evaluation
| Criterion | Band |
|---|---|
| Task Achievement / Task Response | 6.0 |
| Coherence and Cohesion | 6.5 |
| Lexical Resource | 5.5 |
| Grammatical Range and Accuracy | 5.5 |
| Overall | 6.0 |
Task Achievement / Task Response: Band 6.0
You cover all three visuals and provide a relevant overview, identifying adults as the largest membership group, fiction as the leading loan category, and fluctuations in borrowing. The age figures and category percentages are reported accurately. However, the overview could describe the loan trend more precisely: loans generally rose from 2007 to 2011, dipped by 2013, then recovered to a high in 2016. Some chart details are also misreported: the 2016 total is about 21,700, not 24,000, and the 2013 figure is about 19,600 rather than 19,000. The membership values are percentages, not numbers of members. More accurate units and trend figures would make the response more complete and clear.
Coherence and Cohesion: Band 6.5
The response has a clear overall arrangement: an introduction, an overview, and separate paragraphs for the pie chart, table, and bar chart. This makes the information easy to locate, and signposts such as “Looking at the pie chart” and “Turning to the table” help guide the reader. The progression is generally logical, though transitions are sometimes mechanical or repetitive, particularly the repeated use of “On the other hand.” The final paragraph also repeats that loans fluctuated before giving the trend details. To strengthen cohesion, use more precise links between the stages of the trend and avoid connectors that suggest contrast when none is needed.
Lexical Resource: Band 5.5
You use a reasonable range of task-related vocabulary, including “represented,” “portion,” “fluctuated,” and “reached its peak,” so the main comparisons are understandable. However, spelling errors and imprecise word choices are noticeable: “diffrent,” “cetegory,” “incresed,” and “steadly” reduce accuracy, while “biggest number” is less suitable for describing a share. Some collocations are awkward, such as “followed with” and “ending with.” Use standard chart language consistently, and check spelling carefully. More precise terms such as “accounted for,” “was followed by,” and “proportion” would make the description more natural and exact.
Grammatical Range and Accuracy: Band 5.5
You attempt a mix of simple and more complex sentences, including clauses with “which” and time links such as “until 2011.” Most of the message remains understandable, but some grammatical errors recur. For example, “the bar chart compare” and “the total number fluctuate” need subject–verb agreement, while “Adults was” and “children's fiction and adult fiction was” also have agreement problems. The sentence beginning “adults made up the biggest number … at 51 members, it was followed…” joins two independent clauses with a comma. Review agreement, articles, and sentence boundaries, and use past tense consistently when describing the 2016 data and historical trend.
See this exact question answered at other band scores. The same prompt compared across bands.
Browse more IELTS Writing model answers or get your own writing scored by the same AI examiner.