Band 6.5 IELTS Writing Task 1 Model Answer
Overall Band Score: 6.5 · Cambridge IELTS 20 · 2026-11-18
IELTS Writing Task 1 question
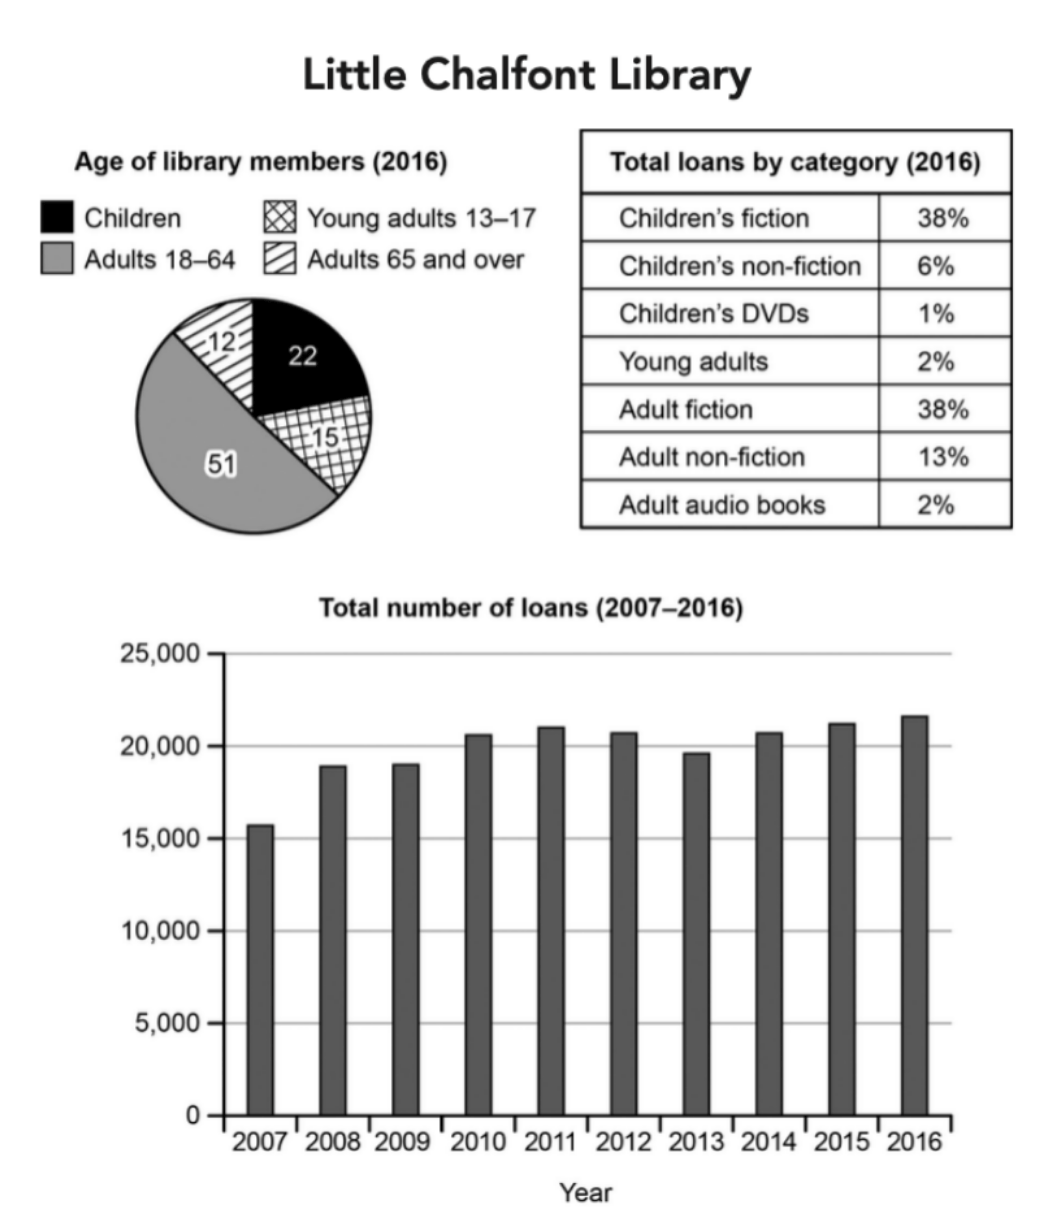
The charts below give information about a public library in a town called Little Chalfont.
Summarise the information by selecting and reporting the main features, and make comparisons where relevant.
Student answer (Band 6.5)
The pie chart represents the distribution of the age of library memebers of 2016 who took loans and it also shows the total loans by seven separate categories where as the bar chart shows the total loans taken from the year 2007 to 2016.
Overall, as per the pie chart, the adults with age group 18-64 years are the majority to take loans in 2016 and children's and adult's fiction category contribute the same percentage to the total loans in 2016. Also, it is clearly visible that in 2016 most of the loans were taken i.e. about 22,000.
Looking closely to the pie chart, it is evident that, children's DVDs,young adults along with adult audio books were not in much demand in 2016 with 1%, 2% adn 2% total loans respectively. Adults with 65 years and above, contributed the lowest in the total loans i.e. 12% followed by yound adults between 13-17 years of age with 15% total loans
In year 2007, the total loans taken were the lowest with approximately 17,000 with gradual increase till 2011. There is gradual decline in the total loans from 2011 to 2013, but the total loans rose up again by 2016
AI examiner evaluation
| Criterion | Band |
|---|---|
| Task Achievement / Task Response | 6.5 |
| Coherence and Cohesion | 6.5 |
| Lexical Resource | 6.0 |
| Grammatical Range and Accuracy | 6.0 |
| Overall | 6.5 |
Task Achievement / Task Response: Band 6.5
You identify the main features: adults aged 18–64 form the largest membership group, the two fiction categories each account for 38% of loans, and borrowing rises overall across the period. These points give the response a relevant overview. However, some details are inaccurate or unclear: 2016 loans are about 21,700, not simply “about 22,000” as the peak without noting that 2015 was also close; the lowest membership share is adults aged 65 and over at 12%, but this is not a share of total loans. The opening also calls the age chart a pie chart, though the key issue is that the age figures are not clearly identified as membership proportions. More precise comparisons and fuller reporting of the category breakdown would strengthen coverage.
Coherence and Cohesion: Band 6.5
The response has a recognisable structure, moving from an introduction to an overview and then to details about the charts. The overview usefully groups the largest age category with the equal fiction shares, and the final paragraph reports the broad rise, fall and recovery in borrowing. However, the organisation is not fully clear because the paragraph beginning “Looking closely to the pie chart” combines membership figures with loan-category figures, while the chart types are misidentified. Some linking is mechanical, particularly “Overall,” “Looking closely,” and “In year 2007.” The final paragraph also ends without a clear concluding comparison. Grouping the membership and loan-category data separately, then describing the time trend, would make progression easier to follow.
Lexical Resource: Band 6.0
You use a reasonable range of task-related vocabulary, including “distribution,” “contribute,” “gradual increase,” and “decline,” and the meaning is generally understandable. There are, however, several spelling errors, such as “memebers,” “adn,” and “yound,” alongside imprecise or awkward choices. “Not in much demand” is less suitable for describing chart proportions, and “taken loans” is repeated where “loans borrowed” or “loans issued” would be more natural. The phrase “total loans by seven separate categories” is also unclear. Greater accuracy in spelling and more precise collocations would improve the report’s fluency and make comparisons sound more academic.
Grammatical Range and Accuracy: Band 6.0
You attempt a mix of simple and complex sentences, including a relative clause in “the bar chart shows the total loans taken from the year 2007 to 2016” and a contrastive sentence describing the rise and fall. Most ideas remain understandable, but some grammatical errors and punctuation problems persist. For example, “the adults with age group 18-64 years are the majority to take loans” has an awkward construction, and “Adults with 65 years and above, contributed” uses an incorrect preposition and an unnecessary comma. The sentence beginning “Looking closely…” also has inconsistent punctuation around its introductory phrase and list. Review article use, prepositions, and sentence punctuation, while retaining the range of structures you are attempting.
See this exact question answered at other band scores. The same prompt compared across bands.
Browse more IELTS Writing model answers or get your own writing scored by the same AI examiner.