Band 5.5 IELTS Writing Task 1 Model Answer
Overall Band Score: 5.5 · Cambridge IELTS 20 · 2026-11-19
IELTS Writing Task 1 question
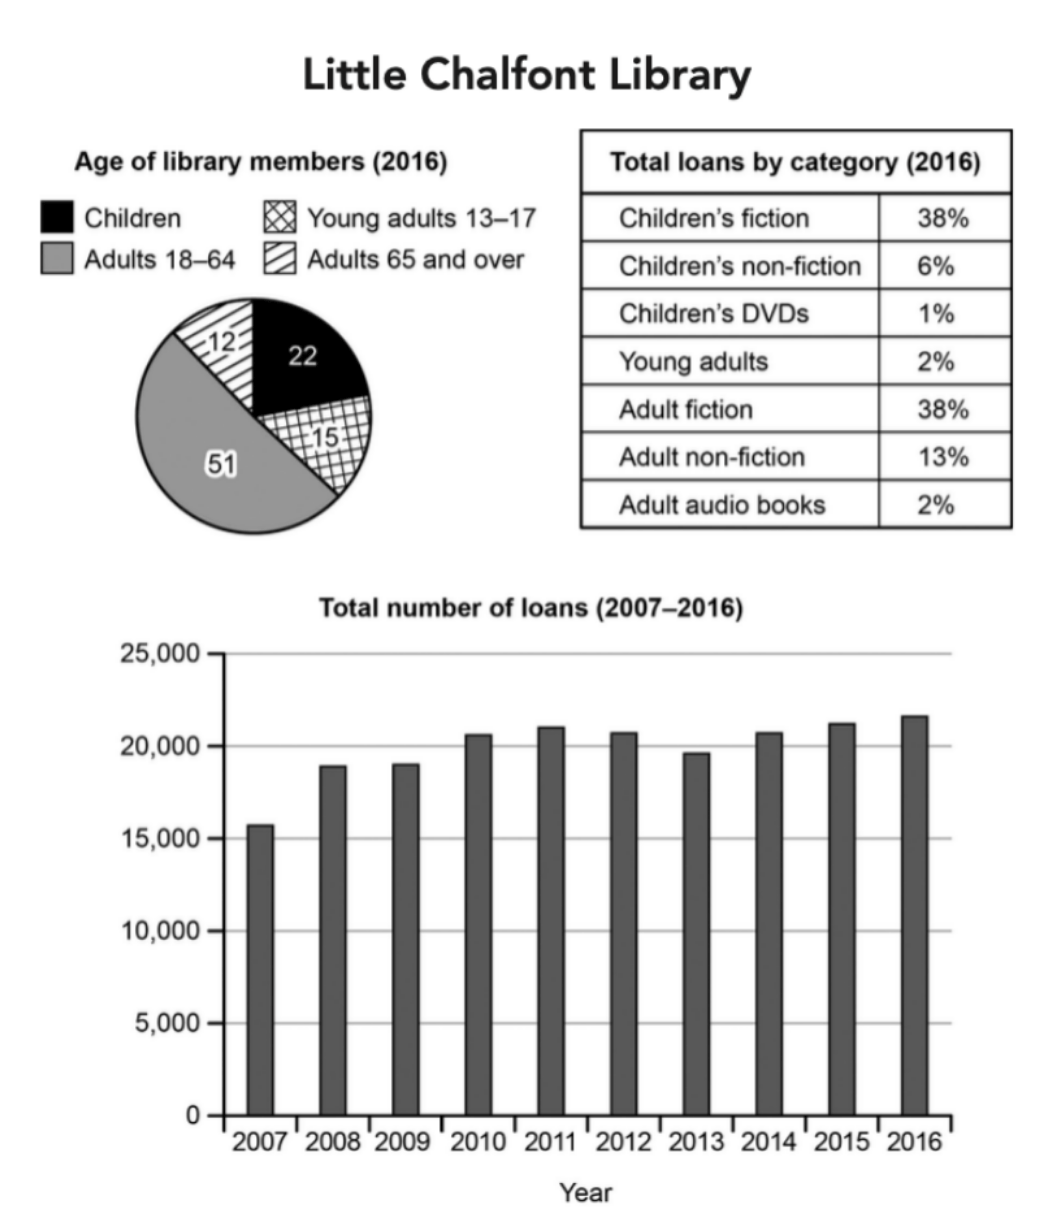
The charts below give information about a public library in a town called Little Chalfont.
Summarise the information by selecting and reporting the main features, and make comparisons where relevant.
Student answer (Band 5.5)
The chart and table below illustrate information about a library which was used by public known as chalfont.
Overall many people visit library but most interested are Adults from 18 years to 64 years .While adults having age 65 and over than it are most least interested .About 12 of them are involved in library.The most high loan was taken by childerns fiction similar by Adult fiction .The most low loan was taken by childern's DVDs about 1%.The highest loan was taken in 2016 about 22,000 loans were taken while in 2007 interest was shown less.
In 2016 library was utilized by different age group people the modert one was childern about 22 members were involved using library.Young Adults having age 13 to 17 are 15 in number as a member of library. Adults having age 18 to 64 having a high ratio as a member of library and was about 51.less interersted were above than 65 only 12.
High loans were taken by different categoriesthe most least was Childern's DVDs only 1% .Childern's ,Adult fiction was same and on top 38%.While a little less than normal loan was by Adult non-fiction.
The most high ratio of loan was in 2016 while 2011,2012 were little bit low than it about approximatiely 21,000.Moreover, other were similar.but the least was in 2007.
In conclusion, different age people are members of library .And amount off loan was taken from 2007 to 2016 .
AI examiner evaluation
| Criterion | Band |
|---|---|
| Task Achievement / Task Response | 6.0 |
| Coherence and Cohesion | 5.5 |
| Lexical Resource | 5.0 |
| Grammatical Range and Accuracy | 5.0 |
| Overall | 5.5 |
Task Achievement / Task Response: Band 6.0
You cover the three visuals and identify several important features: adults aged 18–64 form the largest membership group (51), children’s and adult fiction each account for 38% of loans, and children’s DVDs are the smallest category at 1%. You also note the overall rise in loans from 2007 to 2016. However, some comparisons are unclear or inaccurate: 2016 is the peak at about 21,700, not 22,000, and 2011 and 2012 were not both lower than the later years in the same way; the figures fluctuate, with 2012 at about 20,700. The overview also says people “visit” the library, although the charts show membership and loans. Develop the trend description more precisely and report the category figures more fully, including adult non-fiction at 13%.
Coherence and Cohesion: Band 5.5
The response has an overall structure, with an opening overview followed by paragraphs on membership, loan categories and the time trend. This gives the reader a basic route through the information. However, progression within paragraphs is sometimes difficult to follow, and the final conclusion repeats general points rather than adding a useful summary. Linking is often mechanical or unclear, as in “Moreover, other were similar,” while the sentence beginning “High loans were taken by different categories” runs several ideas together. Use clearer topic sentences and connect each comparison explicitly. For example, group the two 38% fiction categories together, then contrast them with the smaller categories; describe the loan trend chronologically and distinguish its peak from its fluctuations.
Lexical Resource: Band 5.0
You use some relevant chart vocabulary, including “members,” “loan,” “categories,” “ratio” and “fiction,” so the topic is generally recognisable. However, the range is limited and several repeated or inaccurate expressions make the report less precise. Phrases such as “most high loan,” “most least,” “interest was shown less” and “a little less than normal loan” are not natural ways to describe chart data. Spelling errors such as “childerns,” “interersted” and “approximatiely” also reduce control. Aim for concise reporting language and use terms such as “accounted for,” “share,” “proportion,” “peak” and “fluctuated” accurately. Avoid describing membership figures as people’s interest, since the chart reports age-group membership rather than interest.
Grammatical Range and Accuracy: Band 5.0
You attempt both simple and more extended sentences, including comparisons and clauses introduced by “while,” but control is inconsistent. Errors in sentence boundaries and punctuation are especially noticeable: “The chart and table below illustrate information about a library which was used by public known as chalfont” is difficult to parse, and “Childern's, Adult fiction was same and on top 38%” lacks a clear grammatical structure. There are also problems with articles, agreement and sentence construction, as in “Adults having age 18 to 64 having a high ratio … and was about 51.” Use complete sentences with a clear subject and verb, and check punctuation between ideas. A model structure would be: “Adults aged 18–64 made up the largest group, at 51%.”
See this exact question answered at other band scores. The same prompt compared across bands.
Browse more IELTS Writing model answers or get your own writing scored by the same AI examiner.