Band 5.5 IELTS Writing Task 1 Model Answer
Overall Band Score: 5.5 · Cambridge IELTS 20 · 2026-11-19
IELTS Writing Task 1 question
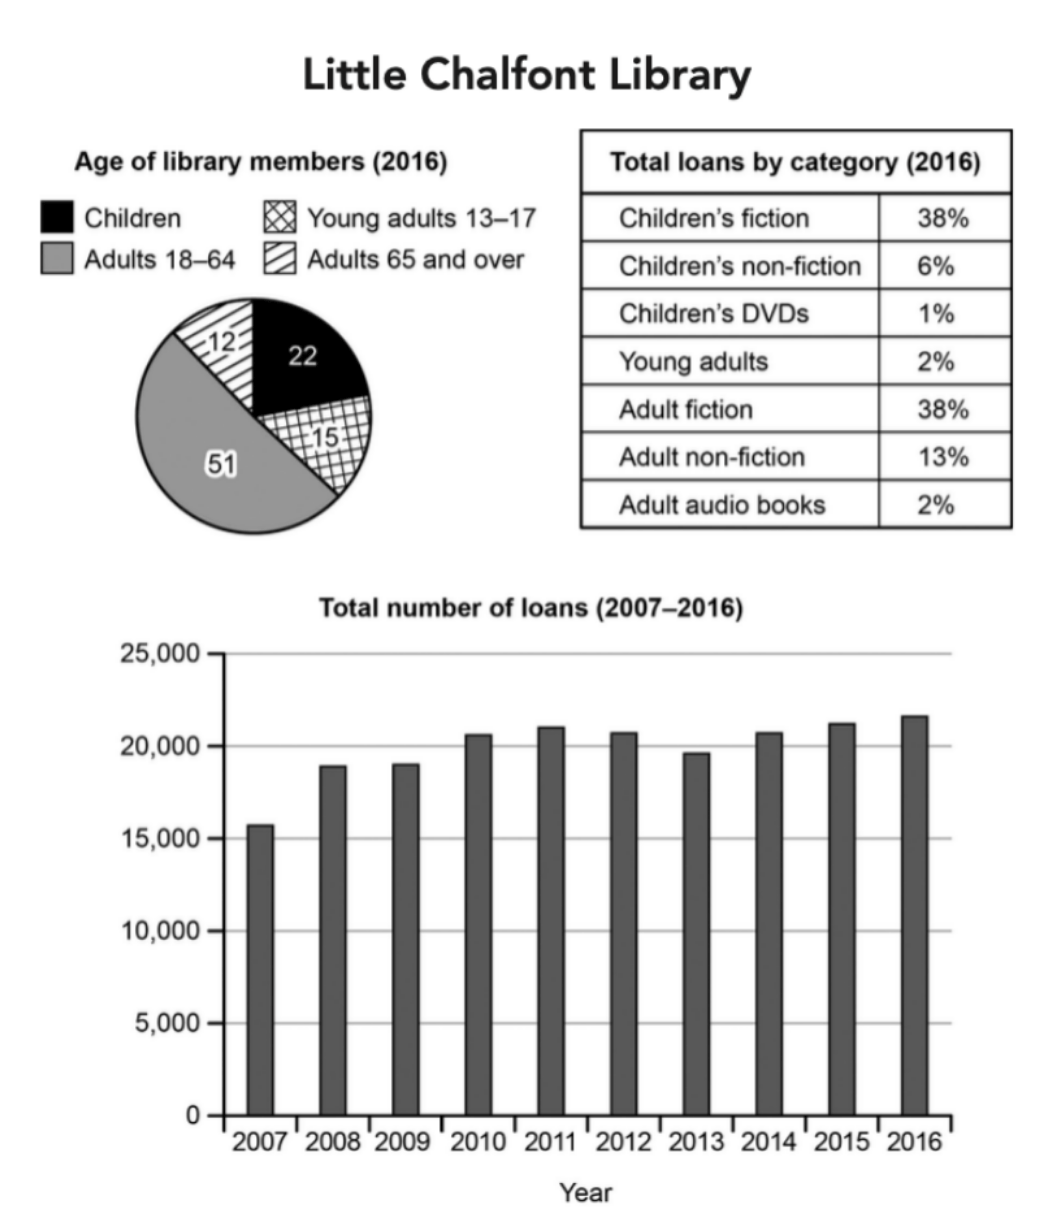
The charts below give information about a public library in a town called Little Chalfont.
Summarise the information by selecting and reporting the main features, and make comparisons where relevant.
Student answer (Band 5.5)
The pie chart users of different age groups usin Little Chalfont library inthe year 2016,while the table depict the proportion of seven book lending across various age group,and the bar graph illustrates the trend in total number of loans from the tear 2007 to 2016.
Overall, it is apparent that adults of age 18-64 were the most popular users of the library while adults of age 65 years and above were least interests in using the facility.In terms of total loans,children's fiction and adult fiction had equal proportion whreas children's dvds were less popular. Additionally the number of borrowers experienced steady growth from 2007 to 2016, thought there was minimal declinebetween 2012 and 2013.
From the pie chart, adults of age 18-64 years accounted for more than half,becoming dominating group in using the library, followed by children and young adults (13-17) who had 22% and 15% respectively . Children fiction and adult fiction books had same total loans and they were most borrowed compared to children dvd and adult audio books which recorded the least loans at 1% and 2% respectively .
moving on, in the year 2007 about
AI examiner evaluation
| Criterion | Band |
|---|---|
| Task Achievement / Task Response | 5.5 |
| Coherence and Cohesion | 5.0 |
| Lexical Resource | 6.0 |
| Grammatical Range and Accuracy | 5.5 |
| Overall | 5.5 |
Task Achievement / Task Response: Band 5.5
You identify several important features accurately: adults aged 18–64 form the largest membership group, children and young adults account for 22% and 15%, fiction loans are tied at 38%, and children’s DVDs are the smallest category at 1%. You also note the slight fall in loans from 2012 to 2013. However, the overview says loans grew steadily, which is not quite accurate because the figures fluctuate across the period. More importantly, the response does not complete its account of the line graph: it stops after “in the year 2007 about” and gives no figures or comparison for the remaining years. The age-group description also omits the 12% share for members aged 65 and over. Cover the main trend and key comparisons across all three visuals more fully.
Coherence and Cohesion: Band 5.0
The response has a recognisable introduction and overview, followed by a paragraph that begins to report chart details. This gives the reader some organisation, and phrases such as “Overall” and “moving on” signal transitions. However, the progression is incomplete: the final paragraph breaks off after introducing 2007, so the loans chart is not developed and the ending feels abrupt. Information from the pie chart and table is also combined in the same paragraph, while the line graph is left without a complete account. Some linking is mechanical or unclear, and punctuation spacing makes connections harder to follow. Use separate, purposeful paragraphs for the overview and the main data groups, and ensure each paragraph develops a complete comparison.
Lexical Resource: Band 6.0
You use a reasonable range of task-related vocabulary, including “accounted for,” “proportion,” “dominating group,” and “least loans,” and the reader can generally understand the intended comparisons. There are also attempts at more formal reporting language, such as “illustrates the trend” and “recorded.” However, several word choices or collocations are inaccurate or awkward: “least interests in using the facility” and “most popular users” do not express the data naturally, while “book lending” is imprecise for the categories shown. Spelling slips such as “whreas” and “tear” also reduce accuracy. Choose standard chart-reporting phrases and check spelling; for example, describe the largest group as “accounted for the highest proportion of members.”
Grammatical Range and Accuracy: Band 5.5
You attempt a mix of sentence forms, including a complex opening with “while” and an overview using “Additionally,” so there is some grammatical range. The main relationships are usually understandable. However, errors in sentence construction and punctuation recur: the opening lacks clear sentence boundaries and has missing spaces, and “children and young adults … who had 22% and 15%” has an unclear relative clause. The phrase “adults of age 18-64 were the most popular users” also shows an awkward grammatical pattern, while the final sentence is unfinished. Use complete, controlled sentences, check articles and clause references, and punctuate consistently. A careful edit for sentence boundaries would make the information easier to follow.
See this exact question answered at other band scores. The same prompt compared across bands.
Browse more IELTS Writing model answers or get your own writing scored by the same AI examiner.