Band 5.5 IELTS Writing Task 1 Model Answer
Overall Band Score: 5.5 · Cambridge IELTS 20 · 2026-11-19
IELTS Writing Task 1 question
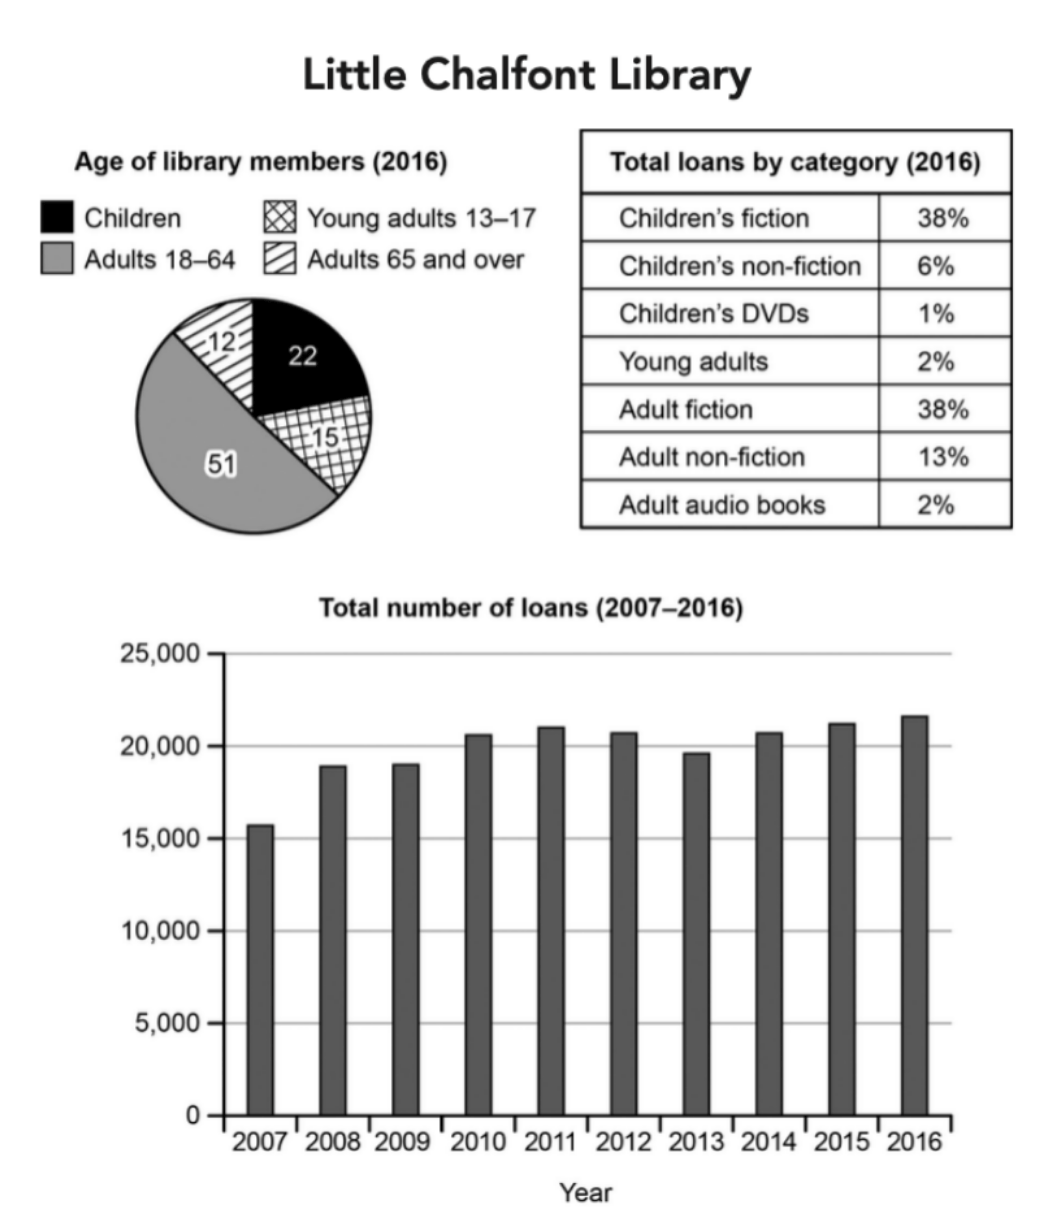
The charts below give information about a public library in a town called Little Chalfont.
Summarise the information by selecting and reporting the main features, and make comparisons where relevant.
Student answer (Band 5.5)
The pie chart, table and bar chart illustrates the percentage of people who used library in a town and the amount of loans took for different books between 2007 and 2016.
Overall, aults used to read book mostly and become the highest member of the library while the highest loan take for childrean's fiction and adult fiction. However,the lowest loan took it for children's DVDs.
The main fact in the pie chart it demonstrate that people who are from 18-64 age range are the highest library member, approximately 51% pepole from this age group use library and the least user are those people whoes age are between 65 or over and only 12% peoples are the member of library.
The table and bar chart shows the amount of loan taken for the different catgory books, it shows that the highest amount loan take it in 2016 and the amount is approximately 23000 and the lowest amount for book loans in 2007 which is 16000.The loan is mostly use in children's fiction and adult fiction almost 38% loans use it for thoes catagory and loans are less cover for the children's dvds and audio book also young adults which is 1% and 2%.
AI examiner evaluation
| Criterion | Band |
|---|---|
| Task Achievement / Task Response | 6.0 |
| Coherence and Cohesion | 6.0 |
| Lexical Resource | 5.0 |
| Grammatical Range and Accuracy | 5.0 |
| Overall | 5.5 |
Task Achievement / Task Response: Band 6.0
You cover the main elements of the charts and give a clear overall summary: adults aged 18–64 form the largest membership group, fiction accounts for the largest loan shares, and children’s DVDs have the smallest share. You also identify the broad endpoints of the loans trend, with 2007 lowest and 2016 highest. However, some details are inaccurate or unclear: the 2016 total is about 21,700, not 23,000, and the smallest category is children’s DVDs at 1%; audio books and young-adult loans are each 2%. The age figures are percentages, but “people” and “members” are used imprecisely. The trend’s rise, dip and recovery are not described, and the overview could compare the two largest age groups and loan categories more clearly.
Coherence and Cohesion: Band 6.0
The response has a recognisable structure, moving from an introduction and overview to details about membership and then loans. This gives the reader a coherent overall arrangement, and phrases such as “Overall” and “The main fact” signal the intended stages. However, progression within the final paragraph is less clear because the table and bar-chart information is combined, and the sentence about the lowest loan categories is difficult to follow. Some linking is mechanical or awkward, particularly “The table and bar chart shows” and the repeated use of “it shows.” Organise the details into clearer comparisons: describe the membership proportions, then the loan-category shares, and finally the trend over time, using precise references to each chart.
Lexical Resource: Band 5.0
You use relevant task vocabulary, including “percentage,” “age range,” “library member,” “loan,” and “category,” so the topic is generally understandable. However, the range is limited and several word-choice, collocation and spelling problems make parts of the report less precise. Examples include “amount of loans took,” “highest amount loan take,” “catgory,” “pepole,” and “childrean’s.” The repeated use of “highest,” “lowest” and “amount” also limits variety. Choose standard chart-reporting expressions such as “accounted for,” “share of loans,” and “number of loans,” and check spelling carefully. More precise vocabulary would help distinguish membership percentages from loan totals and category shares.
Grammatical Range and Accuracy: Band 5.0
You attempt both simple and more complex sentences, including a contrast introduced by “However” and a relative clause in “people who are from 18–64 age range.” The main message is usually recoverable, but some errors in sentence structure, agreement, articles and verb forms reduce accuracy. For example, “The pie chart, table and bar chart illustrates” has a subject–verb agreement error, while “the amount of loans took” and “the highest amount loan take it” have faulty verb patterns. “The main fact in the pie chart it demonstrate” also contains an unclear clause structure. Use a clear subject and verb in each sentence, maintain consistent past or present tense, and check singular/plural agreement and article use. These corrections would make your comparisons easier to read.
See this exact question answered at other band scores. The same prompt compared across bands.
Browse more IELTS Writing model answers or get your own writing scored by the same AI examiner.