Band 5.5 IELTS Writing Task 1 Model Answer
Overall Band Score: 5.5 · Cambridge IELTS 20 · 2026-11-20
IELTS Writing Task 1 question
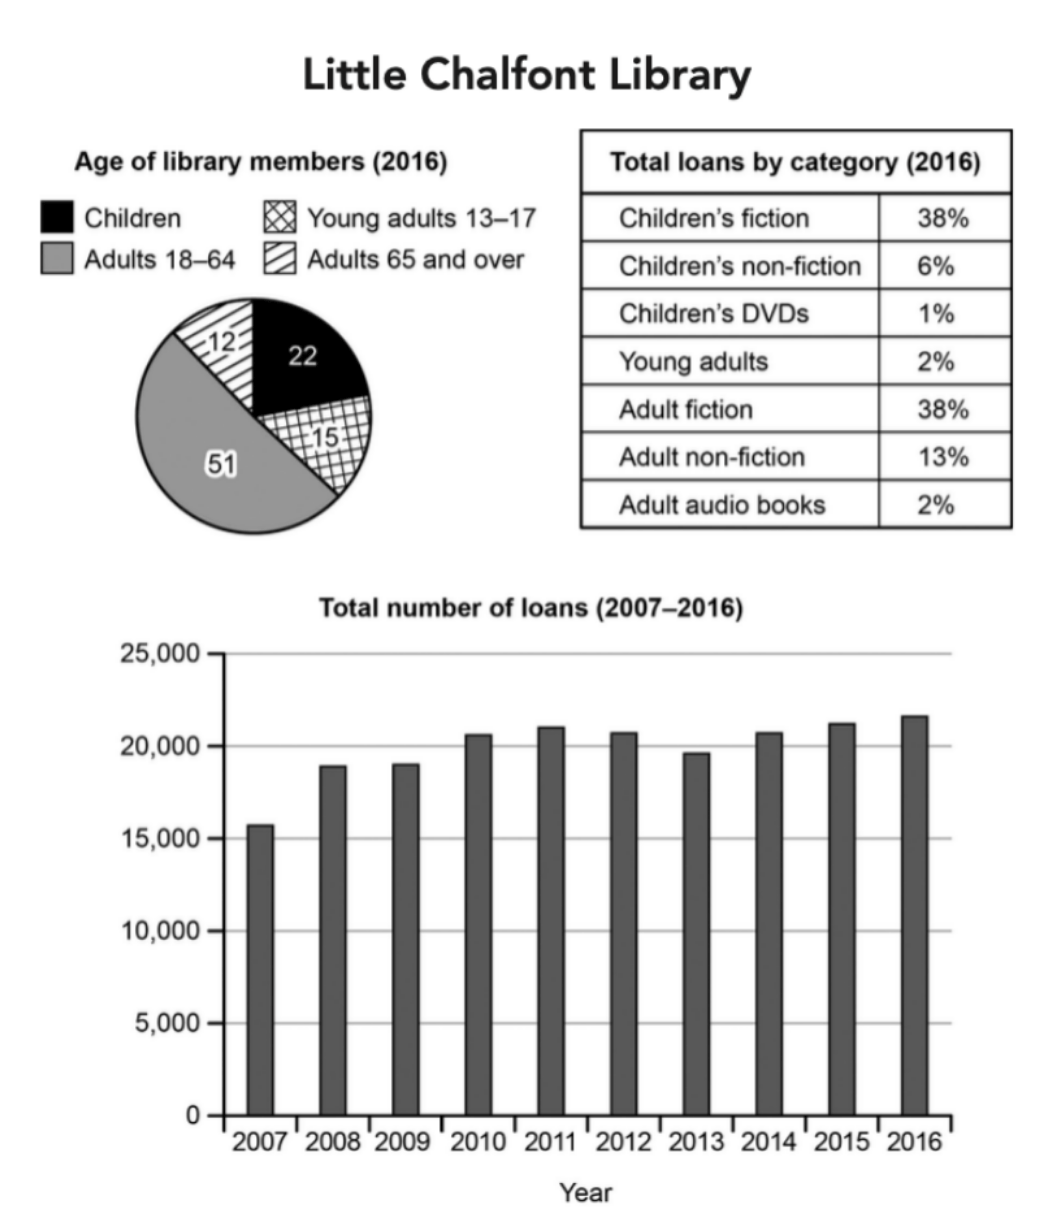
The charts below give information about a public library in a town called Little Chalfont.
Summarise the information by selecting and reporting the main features, and make comparisons where relevant.
Student answer (Band 5.5)
The chart illustrates about a common library in anLittle Chalfont town.
Firstly, the pie chart shows the percentage of library members of different age in year 2016. Adults shows the maximum percentage of 51 and then children shows next highest percentage of 22. Alongside young adults and adults 65 and over are nearby.
After that, the table next to pie chart shows the total loans by different categories in year 2016. Children's fiction and adult fiction leading the top having 38% followed by adult non-fiction of 13%. The remaining categories shows the lowest percentage of loans including 6% of Childrens's non-fiction, yound adults and adult audio books having 2%. Lastly, children's DVDs shows the most lowest percentage of 1.
In the end, the bar chart indicates the total number of loans from year 2007 to 2016. The most leading year which i can see is 2016 and 2015 while the lowest one is 2007.
AI examiner evaluation
| Criterion | Band |
|---|---|
| Task Achievement / Task Response | 5.5 |
| Coherence and Cohesion | 6.5 |
| Lexical Resource | 5.0 |
| Grammatical Range and Accuracy | 5.0 |
| Overall | 5.5 |
Task Achievement / Task Response: Band 5.5
You cover all three visuals and identify several important features, including the largest membership group (adults, 51%), the equal leading loan categories (children’s and adult fiction, 38% each), and the highest and lowest years for total loans. However, the overview is limited: the response does not describe the overall pattern in loans, which rose from 2007 and then fluctuated at a relatively high level. Some details are also missing or unclear, such as the figures for young adults and older adults in the membership chart, and the exact loan totals are not reported. To strengthen the response, give a clear overview of the main patterns and support it with a few accurate comparisons across the charts.
Coherence and Cohesion: Band 6.5
The response has a clear basic structure: it discusses the membership chart, then the loan-category table, and finally the annual loan chart. Sequencing phrases such as “Firstly,” “After that,” and “In the end” help the reader follow this order, and the information is grouped into separate paragraphs. This coherent arrangement meets the core expectations, but the linking is somewhat mechanical and the final paragraph is very brief compared with the others. Some references are also imprecise, as in “the table next to pie chart,” and the response does not connect the key patterns into an overall summary. Use a concise overview and more natural links between comparisons to make the progression smoother.
Lexical Resource: Band 5.0
You use relevant chart vocabulary, including “percentage,” “categories,” “total loans,” and “lowest,” so the topic is generally understandable. However, the range is limited and several word choices or collocations are noticeably inaccurate, such as “common library,” “leading the top,” and “the most lowest percentage.” There are also spelling errors in “yound” and “Childrens's,” which reduce precision. Aim for standard data-reporting expressions and check spelling and word forms carefully. For example, describe a group as “accounting for” a percentage, say that a category “recorded” a share, and use “the smallest proportion” rather than an incorrect superlative.
Grammatical Range and Accuracy: Band 5.0
Most sentences are simple, and the reader can usually understand the intended comparisons. However, the range of sentence structures is limited, and errors in articles, agreement, and sentence construction occur repeatedly. Examples include “in anLittle Chalfont town,” “Adults shows,” and “the remaining categories shows”; these should be revised to use a correct article or preposition and subject–verb agreement. The phrase “Adults shows the maximum percentage of 51” also needs a clearer grammatical structure, such as “Adults made up the largest group, at 51%.” Practise combining accurate simple sentences with controlled comparative clauses, and check each sentence for a clear subject and correctly matched verb.
See this exact question answered at other band scores. The same prompt compared across bands.
Browse more IELTS Writing model answers or get your own writing scored by the same AI examiner.