Band 5.5 IELTS Writing Task 1 Model Answer
Overall Band Score: 5.5 · Cambridge IELTS 20 · 2026-11-20
IELTS Writing Task 1 question
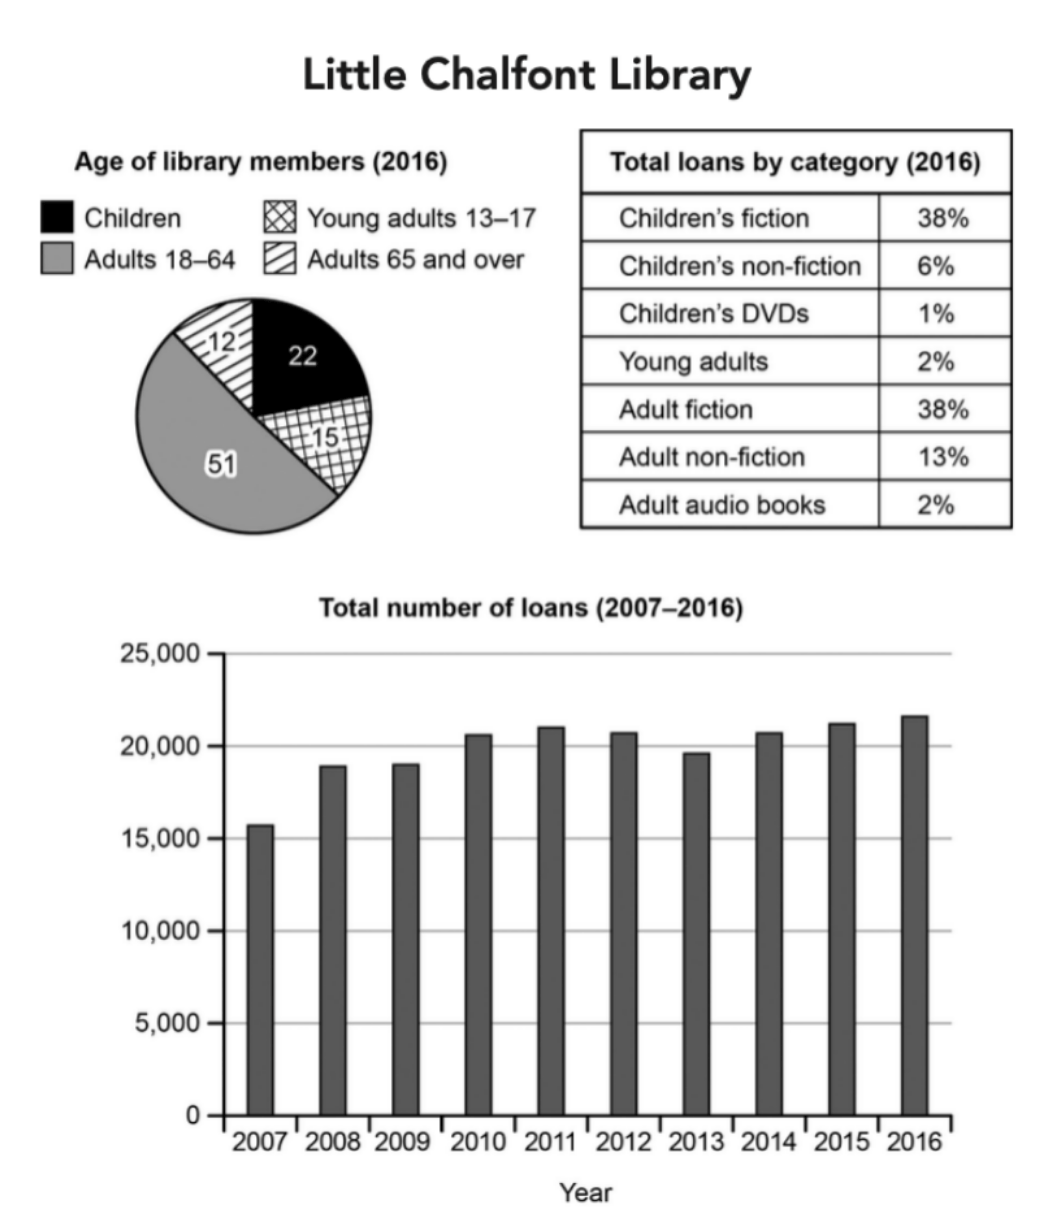
The charts below give information about a public library in a town called Little Chalfont.
Summarise the information by selecting and reporting the main features, and make comparisons where relevant.
Student answer (Band 5.5)
The chart demonstrate the information about the public library in town know as Little Chalfont.
Little Chalfont has diffrent age of library members in 2016, The highest number of people who are member of library is Adults arround 51%. The second highest is children 22%. Where the lowest is 12% and 15% which is young adults and adults over 65.
Total loans by category which wher taken my people from Little Chalfront library has the highest number of children's friction 38% similarly Adult friction also 38%. Others thing like Children's non-friction, children's dvds, young adults, adult non-friction and adult audio books ranges from lowest 1% to highest 13%.
The total numbers of loans in 2007 were 15,000+ which increased till 2008 reaching more then 18,000+. After that from 2008 to 2009 it reamed constant. It started to increased till 2011 reaching 21,000. After that it had a small decrease from 2011 to 2013 reaching 19,000. After that it had a large increase from 2013 to 2016 reaching 23,000.
In conclusion this define that the public library loan has been increaed by time specailly in adult or childrent friction books.
AI examiner evaluation
| Criterion | Band |
|---|---|
| Task Achievement / Task Response | 6.0 |
| Coherence and Cohesion | 6.0 |
| Lexical Resource | 5.0 |
| Grammatical Range and Accuracy | 5.0 |
| Overall | 5.5 |
Task Achievement / Task Response: Band 6.0
You cover all three visuals and identify several important features, including the equal 38% shares for children’s and adult fiction and the overall rise in loans. The membership figures are mostly reported correctly, although the age groups are described as percentages rather than simply as the chart’s figures, and the ordering of the two smallest groups is unclear. Some trend details are inaccurate: loans peak at about 21,700 in 2016, not 23,000, and the 2011–2013 decline ends at roughly 19,600, rather than 19,000. The overview is also limited: the conclusion focuses on fiction, but does not clearly summarise the main pattern across all three visuals. Select the key comparisons and report the trend more precisely.
Coherence and Cohesion: Band 6.0
The response has a clear overall arrangement: it moves from membership to loan categories, then to the time series, with a separate concluding statement. This makes the information reasonably easy to follow. However, progression within paragraphs is sometimes mechanical, particularly in the repeated sequence “After that” and “It started to increased.” The final conclusion repeats the general idea of rising loans without adding a clear synthesis of the charts. Some references are also difficult to follow, such as “the lowest is 12% and 15% which is young adults and adults over 65,” where the group-to-value links are not immediately clear. Use more varied linking and make comparisons explicit within each paragraph.
Lexical Resource: Band 5.0
You use some relevant chart vocabulary, including “highest,” “lowest,” “increased,” “decrease,” and “constant,” so the reader can understand the broad comparisons and trends. However, the range is limited and several noticeable spelling and word-choice errors make parts difficult to interpret: “friction” is used for “fiction,” “non-friction” for “non-fiction,” and “reamed constant” appears to mean “remained constant.” Phrases such as “other things” and “large increase” are also imprecise for describing data. Build a more accurate set of terms for categories and trends, and check spelling carefully, especially for key labels taken directly from the chart.
Grammatical Range and Accuracy: Band 5.0
You attempt both simple and more extended sentence forms, for example, “After that from 2008 to 2009 it reamed constant” and “After that it had a small decrease from 2011 to 2013.” The basic sequence of events is generally understandable, but some grammatical errors affect clarity. The opening, “The chart demonstrate,” has subject–verb disagreement, while “It started to increased” uses the wrong verb form after “to.” Capitalisation and sentence boundaries are also inconsistent, as in “in 2016, The highest number.” Practise accurate past-tense reporting and agreement, and use a wider range of controlled sentence patterns to connect figures and comparisons.
See this exact question answered at other band scores. The same prompt compared across bands.
Browse more IELTS Writing model answers or get your own writing scored by the same AI examiner.