Band 5.5 IELTS Writing Task 1 Model Answer
Overall Band Score: 5.5 · Cambridge IELTS 20 · 2026-11-20
IELTS Writing Task 1 question
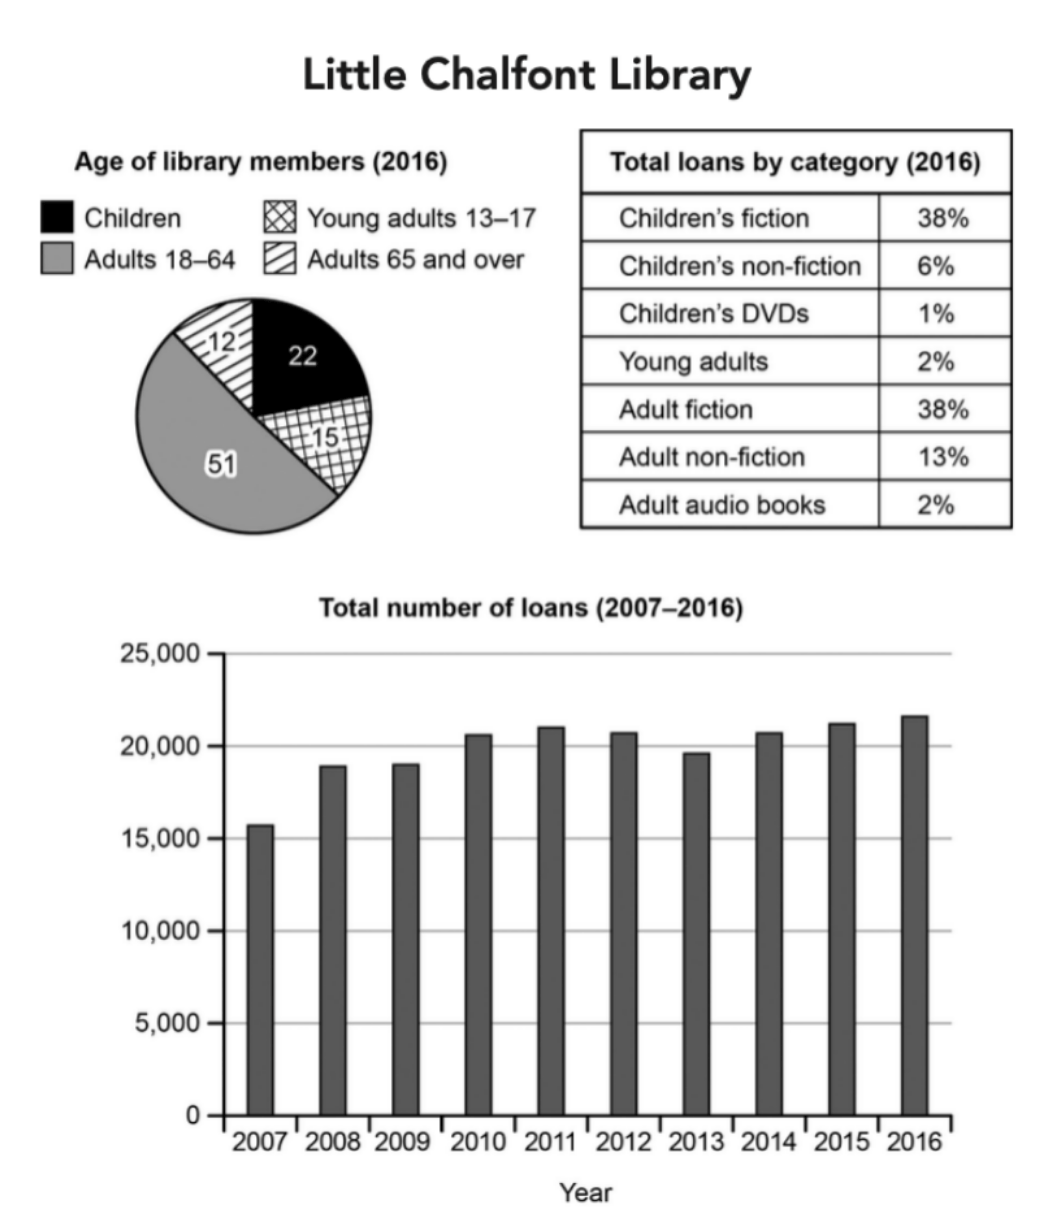
The charts below give information about a public library in a town called Little Chalfont.
Summarise the information by selecting and reporting the main features, and make comparisons where relevant.
Student answer (Band 5.5)
The piechart, a table and bar diagram illustrate a town called Little Chalfont community library information in 2016.
Overall, the piechart depicts age of library members from which adults make the majority. The chart shows total loans by category in 2016; in which children's and adult fiction account for high proportion. In addition, the bar chart illustrate total number of loans in rupees from 2007 to 2026.
The pie chart shows that adults 18 to 64 made the majority of library membership that is 51% followed by children that made 22%.
The chart displays loan percentage of books. Children and adult fiction made 38% in 2016 and the rest were unremarkable.
The bar chart showed that overall trend was almost consistent from 2008 to 2016 that were fluctuationg around 20,000 while it was around 15,000 in 2007.
AI examiner evaluation
| Criterion | Band |
|---|---|
| Task Achievement / Task Response | 5.0 |
| Coherence and Cohesion | 6.0 |
| Lexical Resource | 5.5 |
| Grammatical Range and Accuracy | 5.5 |
| Overall | 5.5 |
Task Achievement / Task Response: Band 5.0
You identify the main membership feature—adults aged 18–64 form the largest group—and note that children’s and adult fiction are the largest loan categories. However, the report covers the charts only partially: it omits the other membership figures and category percentages, and gives little detail about the loan trend. The overview also mislabels the time span as 2007–2026; the chart ends in 2016. The description that loans were “almost consistent” misses the rise from about 15,700 in 2007 to over 20,000 by 2010, followed by fluctuations and a high of roughly 21,700 in 2016. The response is also 13 words below the required minimum. Include a fuller overview and select key figures to support each chart’s main features.
Coherence and Cohesion: Band 6.0
The response has a recognisable structure: an introduction, an overview, and separate comments on membership, loan categories and the trend. This makes the information reasonably easy to follow. Linking phrases such as “Overall,” “In addition” and “followed by” help signal relationships, although some connections are mechanical or unclear. For example, “The chart shows total loans by category in 2016; in which…” does not connect the clauses smoothly, and “the rest were unremarkable” does not specify what the remaining categories represent. The final paragraph also moves quickly from the general trend to the 2007 figure without developing the comparison. Use clearer sentence links and organise the details into fuller, logically connected comparisons.
Lexical Resource: Band 5.5
You use some relevant chart vocabulary, including “majority,” “proportion,” “fluctuation” and “total number of loans,” so the topic is generally clear. However, the range is limited and several choices are inaccurate or unnatural: “piechart” should be written as “pie chart,” “bar diagram” is less suitable than “bar chart,” and “loans in rupees” is incorrect because the chart reports numbers of loans, not currency. “The rest were unremarkable” is also vague and does not describe the smaller categories precisely. There is a spelling error in “fluctuationg.” Aim for precise terms such as “membership share,” “loan categories” and “remained relatively stable,” while checking spelling and avoiding unsupported wording.
Grammatical Range and Accuracy: Band 5.5
You attempt both simple and more complex sentence forms, and the main meaning is usually understandable. Some grammatical errors remain, particularly in agreement and clause construction. For example, “the bar chart illustrate” needs subject–verb agreement (“illustrates”), while “the overall trend was almost consistent … that were fluctuationg” has an unclear relative clause and incorrect verb form. The phrase “adults … made the majority … that is 51%” also needs a more controlled structure, such as “Adults aged 18–64 made up the largest share, at 51%.” There is some sentence variety, but several sentences rely on basic patterns or contain faulty links. Practise accurate comparisons and complex clauses, and check agreement and tense consistency.
See this exact question answered at other band scores. The same prompt compared across bands.
Browse more IELTS Writing model answers or get your own writing scored by the same AI examiner.