Band 5.0 IELTS Writing Task 1 Model Answer
Overall Band Score: 5.0 · Cambridge IELTS 20 · 2026-11-21
IELTS Writing Task 1 question
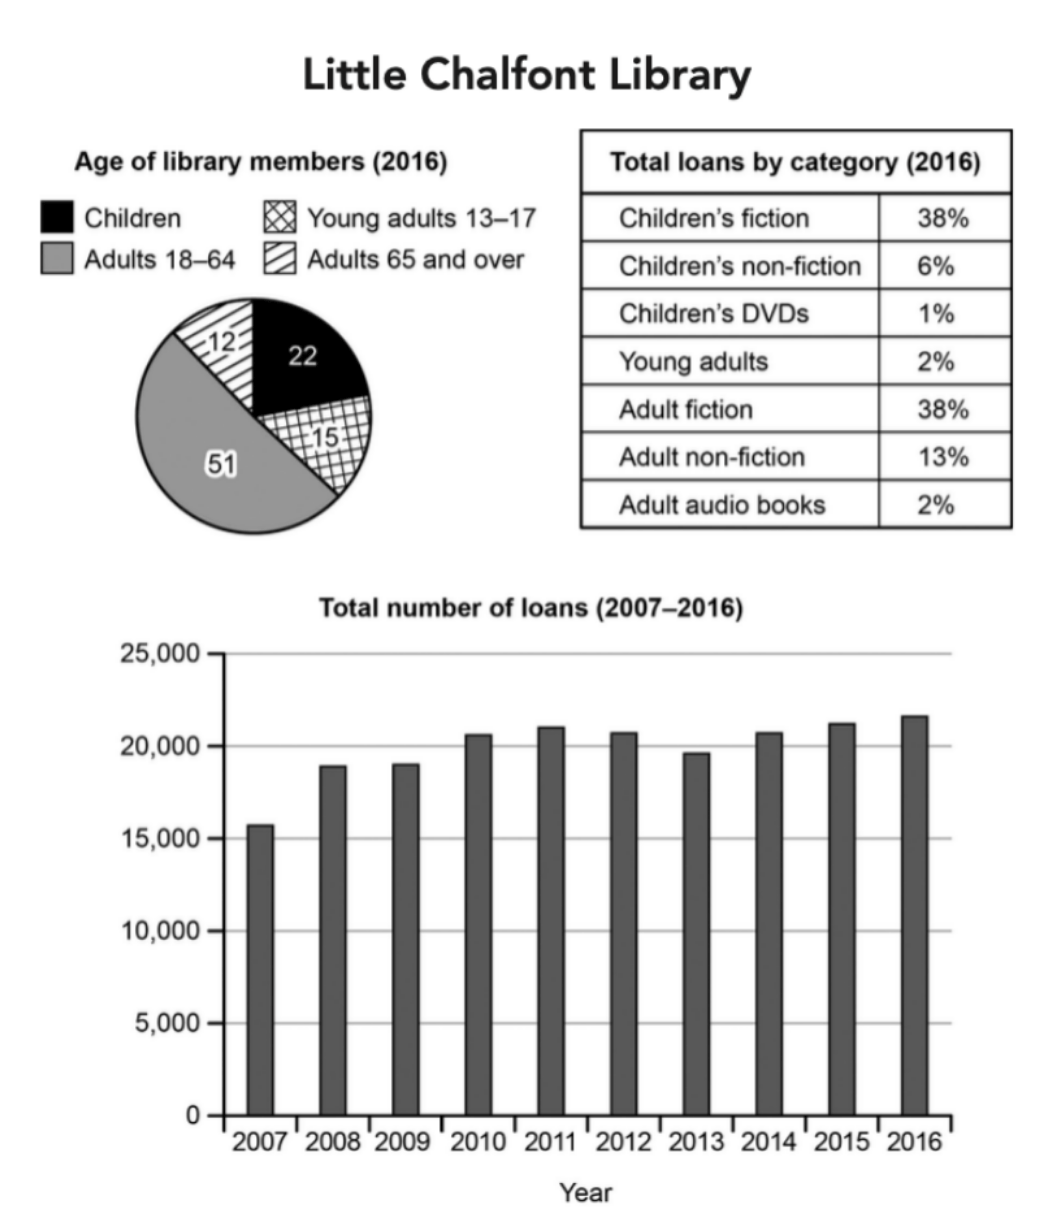
The charts below give information about a public library in a town called Little Chalfont.
Summarise the information by selecting and reporting the main features, and make comparisons where relevant.
Student answer (Band 5.0)
The chart demonstrates the information regarding the individuals library in a town referred to as little Chalfont.
overall, little Chalfont library describe the age of library members and the total loans by category in addition the total number of loans.
young children are 22 and young adults which age is 13 to 17 is 15 and the adults 18 to 64 age group is 51 in addition adults 65 and over are 12. total loans by category in 2016 children friction 36% children non friction is 6% children DVDs 1% young adults 2% adult fiction is 38% adult non fiction 13% adult audio books 2%
total number of loans in 2007 to 2019 the number of increase year by year in 2007 the number of loans is 15000 and its some times increase and some times decrease like in the year of 2013 the number of loans is around 19000 but in the year of 2016 the number of loans is rise around 3000 in 2016 the number of loans is 22000.
AI examiner evaluation
| Criterion | Band |
|---|---|
| Task Achievement / Task Response | 5.0 |
| Coherence and Cohesion | 5.5 |
| Lexical Resource | 5.0 |
| Grammatical Range and Accuracy | 5.0 |
| Overall | 5.0 |
Task Achievement / Task Response: Band 5.0
You identify the three chart topics and report several relevant figures, including the member age-group values and most loan-category percentages. However, the response only partly summarises the main features: it gives little comparison or overview of the key patterns. The loan trend is also inaccurately described. Loans did not increase year by year; they rose overall from about 15,700 in 2007, fluctuated, and reached about 21,700 in 2016. The statement that 2013 was around 19,000 is close, but saying loans rose by around 3,000 in 2016 is unclear and does not describe the change from 2015. There are also small data errors, such as children’s fiction at 36% rather than 38%, and the period ending in 2019 rather than 2016. Select the main trends and compare them accurately.
Coherence and Cohesion: Band 5.5
The response has a basic structure: an opening, a brief overview, and separate sections for the membership/category figures and the loan trend. This helps the reader recognise the chart topics. However, progression is limited, and the overview mostly lists what the charts show rather than highlighting their main patterns. Connections between ideas are often mechanical, especially the repeated use of “and” and “in addition.” The final paragraph also combines several trend claims without a clear sequence, making the changes over time difficult to follow. Organise the details into clearer comparisons—for example, group the two largest age categories and the two largest loan categories, then describe the overall rise and fluctuations in loans chronologically. Use linking phrases selectively to show contrast and change.
Lexical Resource: Band 5.0
You use some relevant chart vocabulary, including “age group,” “total loans,” “category,” and “increase,” so the topic is generally recognisable. However, the range is limited and several word choices or spellings make the meaning less clear. “Individuals library” is not a natural way to describe the subject, while “children friction” and “children non friction” appear to mean “children’s fiction” and “children’s non-fiction.” The phrase “the number of loans is rise” also shows inaccurate word choice and form. Use precise terms such as “members,” “loan share,” “fiction,” and “fluctuated” when describing the data. Check spelling and collocations carefully, as errors in key chart labels can confuse the reader even when the intended category is inferable.
Grammatical Range and Accuracy: Band 5.0
The response communicates information through mostly simple clauses and makes an attempt at a longer sentence when describing the loan trend. However, the range is limited, and errors are frequent enough to make some sentences difficult to interpret. For example, “the total number of loans in 2007 to 2019 the number of increase year by year” lacks a clear grammatical structure, and “the number of loans is rise around 3000” has an incorrect verb construction. There are also problems with articles, agreement, and sentence boundaries, as in “overall, little Chalfont library describe.” Build accurate simple sentences first, using past tense for the historical data (“loans rose,” “the figure reached”), then add comparisons with “while” or “whereas.” Use consistent capitalisation and punctuation to separate complete ideas.
See this exact question answered at other band scores. The same prompt compared across bands.
Browse more IELTS Writing model answers or get your own writing scored by the same AI examiner.