Band 6.0 IELTS Writing Task 1 Model Answer
Overall Band Score: 6.0 · Cambridge IELTS 20 · 2026-11-21
IELTS Writing Task 1 question
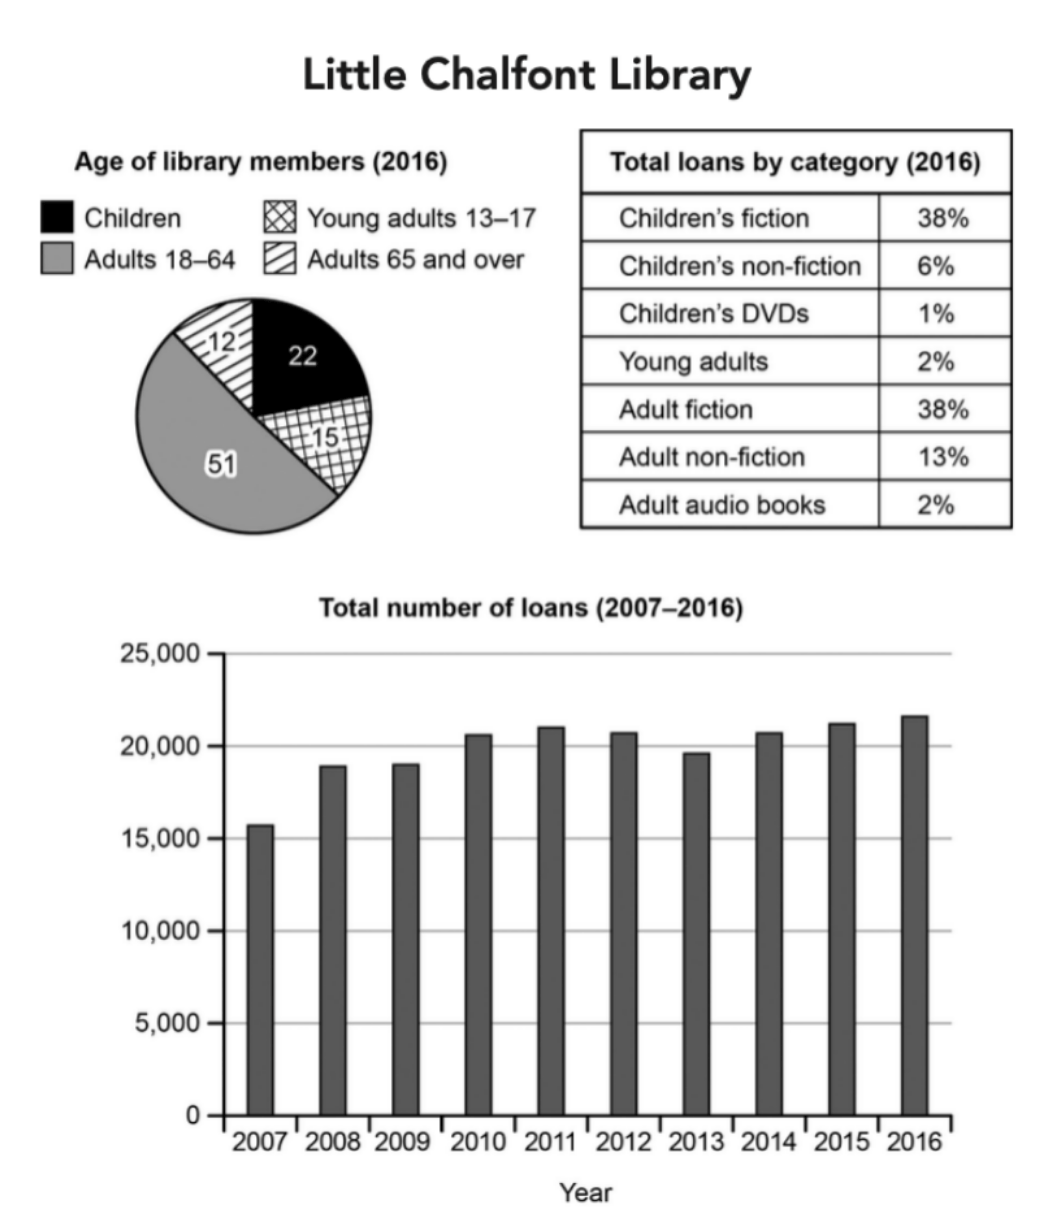
The charts below give information about a public library in a town called Little Chalfont.
Summarise the information by selecting and reporting the main features, and make comparisons where relevant.
Student answer (Band 6.0)
The pie charts demonstartes proportion of different age people who are the members of the library and the chart describes information about the different books which are borrowed through out 2016. However the bar graph illustrates the comparison the number of borrowed books between 2007 to 2016.
Overall, mostly people aged 18-64 are the members of library while 65+ shares low proportion , however the most borrowed book is children fiction but in childrens DVD's the people are less interested, Furthermore the interest in borrowing books is increased from 2007 to 2016.
Initially, the population aged 18-64 they are take more part in library which is 51% and this trend is followed by the children which shares membership of 22% after this the young adults 13-17 and 64+ adults shares low proportion in taking membership in libaray.
On the other hand, the most borrowed book is adults and childrens fiction books which shows 38% because people show more interest in these books, the people show little interest in adult non-fiction books and the least loaned books are audio, DVD'S, young adults & childrens non-fiction books which ranges from 6 to 1%. However the interest of people slightly increased in loans of book from library from 2007 to 2016 which was around 16000 books borrowed and in 2016 the number raised to around 23000 books.
AI examiner evaluation
| Criterion | Band |
|---|---|
| Task Achievement / Task Response | 6.5 |
| Coherence and Cohesion | 6.5 |
| Lexical Resource | 5.5 |
| Grammatical Range and Accuracy | 5.0 |
| Overall | 6.0 |
Task Achievement / Task Response: Band 6.5
You cover all three visuals and provide a clear overview: adults aged 18–64 form the largest membership group, children’s and adult fiction lead loans, and borrowing rises overall. Several key figures are accurate, including the 51% membership share and the two 38% loan categories. However, some details are unclear or inaccurate: the smallest membership group is adults aged 65 and over (12%), but “64+ adults” is imprecise; the least-borrowed categories are not all between 1% and 6%, since adult audio books and young adults are 2%. The final loan figure is about 21,700, not 23,000. To strengthen the response, report the fluctuations in the loan trend, including the peak in 2016 and the dips after 2011.
Coherence and Cohesion: Band 6.5
The response has a recognisable structure, moving from an introduction to an overview and then to details about membership, loan categories and the time series. This gives the reader a coherent overall route through the information. Some linking is effective, such as “Overall” and “On the other hand,” but transitions are sometimes mechanical or do not express the relationship clearly. For example, “On the other hand” introduces another chart rather than a genuine contrast, and the final sentence combines the long-term trend with endpoint figures without explaining the intervening fluctuations. The overview also packs several comparisons into one sentence. Use clearer paragraphing for each visual and connect details with more precise references, so the progression is smoother and less dependent on repeated “however” and “which.”
Lexical Resource: Band 5.5
You use relevant vocabulary for describing charts, including “proportion,” “membership,” “borrowed,” “interest” and “increased,” so the main information is generally understandable. However, the range is limited and several choices are imprecise or repetitive. “The most borrowed book is adults and childrens fiction books” confuses categories with individual books; “loan categories” or “items borrowed” would be clearer. “Shares low proportion” and “take more part in library” are unnatural collocations, while “the interest ... is increased” is an awkward way to describe the data. Spelling errors such as “demonstartes,” “through out” and “libaray” also reduce accuracy. Aim for precise chart language and check spelling, especially in repeated key terms.
Grammatical Range and Accuracy: Band 5.0
You attempt both simple and complex sentences, including clauses introduced by “while,” “which” and “however,” but control is inconsistent. Errors in verb forms and agreement appear in “the pie charts demonstartes” and “they are take more part”; the latter also shows an incomplete verb pattern. Articles and sentence construction are problematic in “members of the library” and “the population aged 18-64 they are take more part,” where the subject is repeated and the clause is not well formed. Some long sentences join several ideas with commas, making relationships harder to follow. Use a reliable pattern such as “Adults aged 18–64 made up 51% of members,” then add one comparison at a time. More accurate simple sentences alongside carefully controlled complex clauses would improve clarity.
See this exact question answered at other band scores. The same prompt compared across bands.
Browse more IELTS Writing model answers or get your own writing scored by the same AI examiner.