Band 5.5 IELTS Writing Task 1 Model Answer
Overall Band Score: 5.5 · Cambridge IELTS 20 · 2026-11-21
IELTS Writing Task 1 question
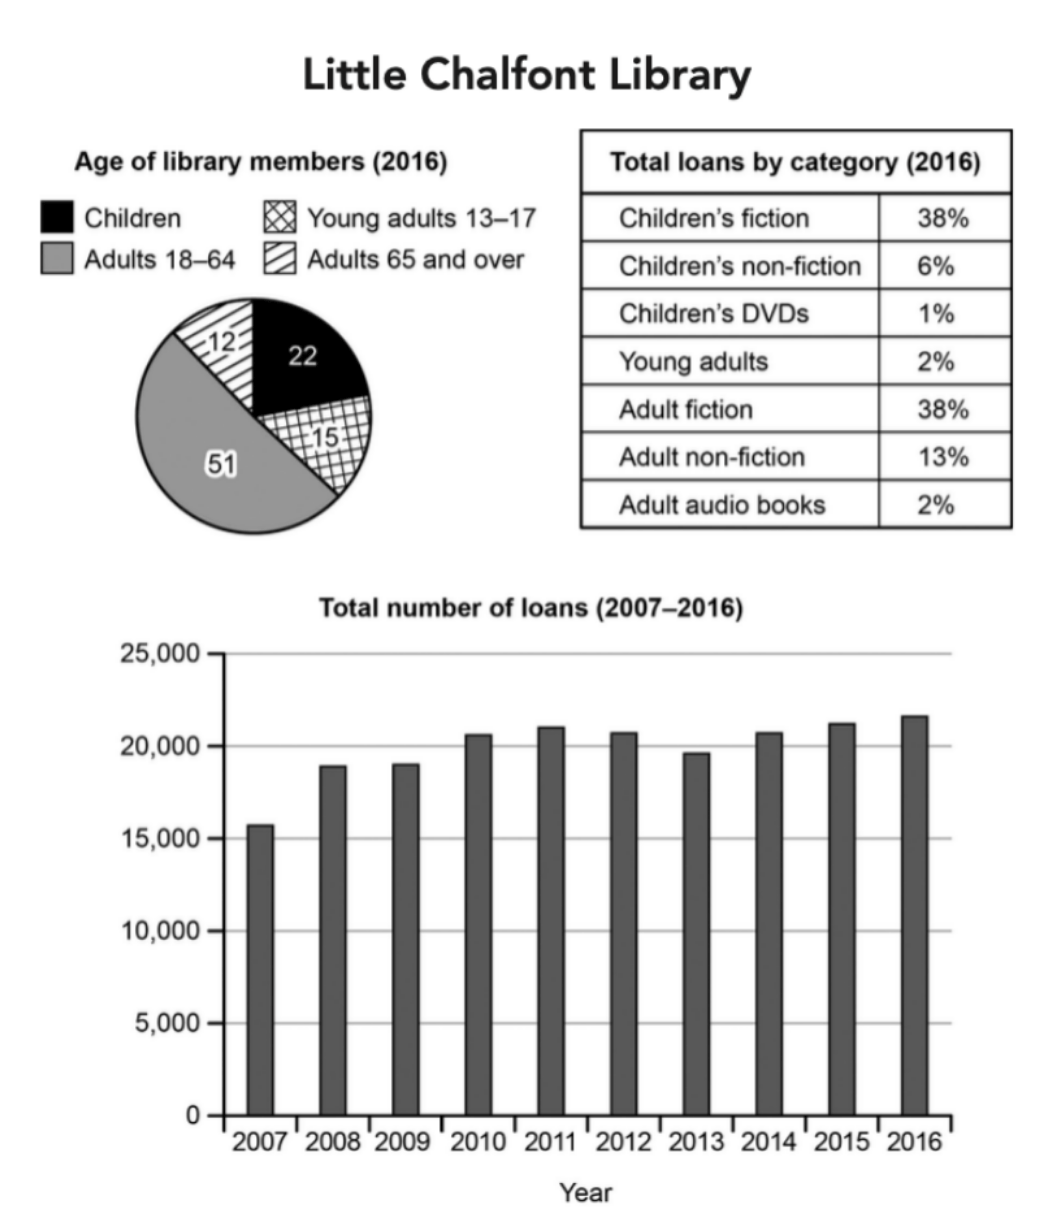
The charts below give information about a public library in a town called Little Chalfont.
Summarise the information by selecting and reporting the main features, and make comparisons where relevant.
Student answer (Band 5.5)
The pie chart illustrates the age of the library members and table gives total loads by category as well as bar chart compare the total number of the loans from 200 to 2016.
Overall, pie chart presents the age of library with four category (children,young adults,adults and adults and over),while table gives the proportion of the data by category of loans.However, bar chart illustrates the total number of loans that increased over the period.
firsly pie chart, compare the four categories and adults from 18-64 obtain 51% of the library while, children contain 22%.However, young adults from 13 to 17 and adults 65 and over obtain 12% and 15% respectively.
Secondly table and bar chart, represents the total loans by category and yearly .Moreovere, in the table childrens fiction and adult fiction recorded highest by 2016 while,childrens DVDs ,young adults and adult audio book recorded lowest respectively.Additionally, number of loans increased over the period from 2007 at around 15000 and in 2016 that loans reached to more then 20,000.
AI examiner evaluation
| Criterion | Band |
|---|---|
| Task Achievement / Task Response | 6.0 |
| Coherence and Cohesion | 6.0 |
| Lexical Resource | 5.5 |
| Grammatical Range and Accuracy | 5.0 |
| Overall | 5.5 |
Task Achievement / Task Response: Band 6.0
You identify the main components and give a broad overview, noting that adult members form the largest group and that total loans rise overall. Several figures are reported accurately, including 51% for adults aged 18–64 and 22% for children. However, the age figures for the two smaller groups are reversed: young adults are 15%, while members aged 65 and over are 12%. The description of the loan categories is also incomplete: fiction accounts for 38% in both children’s and adult categories, while adult non-fiction is 13%; the lowest categories are not clearly distinguished. The trend is broadly correct, but the chart fluctuates rather than increasing steadily. More precise comparisons and coverage of these features would strengthen the report.
Coherence and Cohesion: Band 6.0
The response has a recognisable structure: an introduction, an overview, and two body paragraphs, with the charts grouped in a generally sensible way. Sequencing phrases such as “Overall,” “Firstly,” and “Secondly” help the reader follow the report. However, the progression is sometimes mechanical, and the second body paragraph combines the table and bar chart without clearly separating their key information. Some links are awkward or unclear, particularly “while” in “adults from 18-64 obtain 51% … while, children contain 22%.” Punctuation spacing and sentence boundaries also make connections harder to follow. Organise each paragraph around a clear comparison, and use linking words only where the relationship between the figures is explicit.
Lexical Resource: Band 5.5
You use relevant task vocabulary, including “proportion,” “category,” “total number of loans,” and “increased,” so the main information is generally understandable. There is also some attempt to vary wording, for example “reached” and “recorded.” However, several choices are inaccurate or unnatural: “loads” should be “loans,” “children contain 22%” is not an appropriate collocation, and “recorded highest” needs a clearer expression such as “accounted for the largest shares.” Spelling and word-form errors, including “firsly,” “Moreovere,” and “childrens,” also reduce accuracy. Aim for precise chart language and check spelling and collocations; this will make your comparisons clearer and more natural.
Grammatical Range and Accuracy: Band 5.0
You attempt both simple and more extended sentences, and the overall meaning can usually be followed. However, some sentence structures are incomplete or awkward, as in “The pie chart illustrates the age of the library members and table gives…” and “bar chart compare the total number.” There are also errors in articles, agreement, and sentence construction: “four category” should be plural, and “adults … obtain 51%” does not form a natural grammatical description of the data. Commas and full stops are often misplaced, and spaces after punctuation are missing. Use a reliable pattern such as “The chart shows that…” and check subject–verb agreement, articles, plurals, and sentence boundaries. More consistently controlled complex sentences would improve accuracy.
See this exact question answered at other band scores. The same prompt compared across bands.
Browse more IELTS Writing model answers or get your own writing scored by the same AI examiner.