Band 5.0 IELTS Writing Task 1 Model Answer
Overall Band Score: 5.0 · Cambridge IELTS 20 · 2026-11-22
IELTS Writing Task 1 question
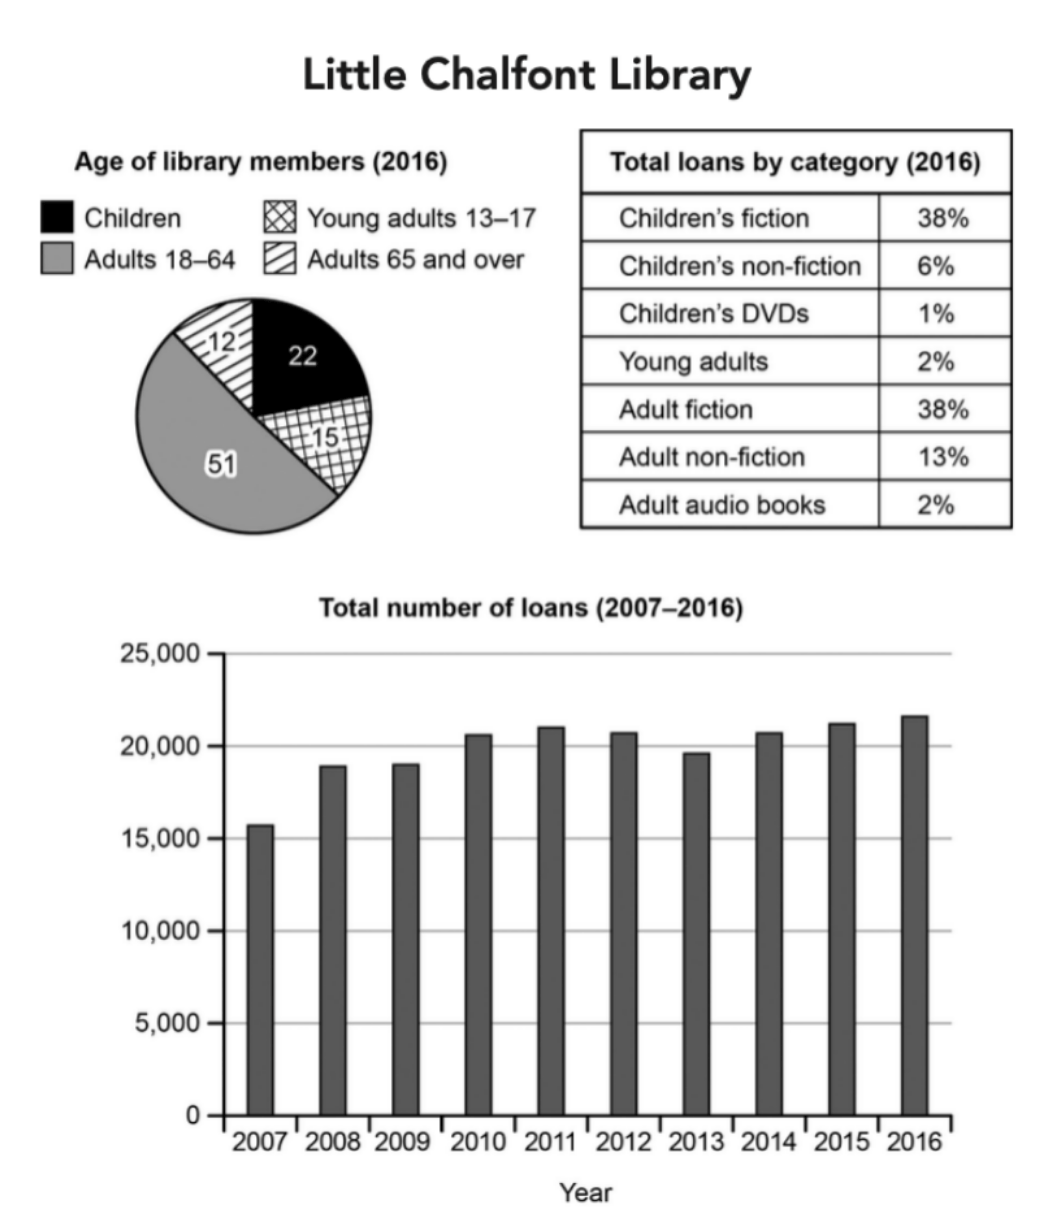
The charts below give information about a public library in a town called Little Chalfont.
Summarise the information by selecting and reporting the main features, and make comparisons where relevant.
Student answer (Band 5.0)
The given information about a public libaray in a town which a called little chalfont. In the pie chat given information about little chalfont library members in year of 2016 which had 22% childern ,13 to 17 year young adults whatever 15%, 18-64% adults 51% and 65 over adults members 12% . However total loans by caegory in year of 2016 children's ficiom 38%,childern's non-fiction 6%, childern's DVDs1%,young adults 2%,adult fiction 38% , adult non-fiction 13% and adult audia books 2%.
In bar diagram given informaton form 2007 to 2016 total number of loans . In year of 2007 total loan alomost 16000 . The loan 2007 to 2016 year respectfully 18000, 18000, 20500, 20600,20500, 19000,20500, 20600 and 20700.the minimum loan in 2007 just almost 16000 , and maximum loan is 20700 In ohter other year like from 2008 to 2015 loan average [redacted phone],20600. in 2013 the loan jsut 19000.
AI examiner evaluation
| Criterion | Band |
|---|---|
| Task Achievement / Task Response | 4.5 |
| Coherence and Cohesion | 5.5 |
| Lexical Resource | 5.0 |
| Grammatical Range and Accuracy | 4.5 |
| Overall | 5.0 |
Task Achievement / Task Response: Band 4.5
You include information from all three visuals, including the member-age percentages, loan-category shares and the overall loan trend, so the response is relevant to the task. However, the main features are not clearly summarised: there is no clear overview of the dominant adult membership and fiction categories or of loans rising overall despite fluctuations. Several figures are also inaccurate. For example, the age chart gives 15% for young adults aged 13–17, not 13%, and the loan series is reported with multiple mismatches, including 2008–09 as 18,000 rather than about 19,000 and 2016 as 20,700 rather than about 21,700. The statement that the average was “120000,20600” is unclear and unsupported. Select the key comparisons and check figures against the chart.
Coherence and Cohesion: Band 5.5
The response has a basic sequence: it first describes the two 2016 charts and then turns to the loan chart. This helps the reader identify which visuals are being discussed. However, the information is crowded into two long paragraphs, and the progression within the second paragraph is difficult to follow. Phrases such as “In bar diagram given informaton” and “In ohter other year” do not clearly connect the points, while the list of yearly figures is hard to interpret because the years are not paired with each value. The final comments repeat the minimum and 2013 figures rather than developing a clear summary. Use separate paragraphs for each visual and organise the trend chronologically, with clear linking phrases and a concise overview.
Lexical Resource: Band 5.0
You use some relevant chart vocabulary, including “total loans,” “members,” “minimum,” “maximum” and category labels such as “adult fiction” and “non-fiction.” This gives the reader a basic sense of the subject. However, the range is limited and several spelling errors or imprecise expressions make the report harder to read, including “libaray,” “pie chat,” “ficiom,” “caegory” and “audia books.” Phrases such as “whatever 15%” and “loan average” are not appropriate or clear in this context. Aim for accurate, neutral reporting language and use terms such as “accounted for,” “proportion” and “fluctuated” where they fit. Proofreading spelling and choosing precise collocations would improve clarity.
Grammatical Range and Accuracy: Band 4.5
You attempt to report figures in both simple statements and longer sentences, but grammatical control is inconsistent and errors sometimes obscure the intended meaning. The opening, “The given information about a public libaray in a town which a called little chalfont,” is a sentence fragment with an incorrect clause structure. In “In the pie chat given information … which had,” the subject and verb relationship is unclear, and the sentence lacks a well-formed main clause. Articles, plurals and punctuation are also unreliable, as in “In bar diagram” and the run-together list of percentages. Use complete sentences with a clear subject and verb, for example, “The charts show membership by age and loans by category in 2016.” Then check sentence boundaries and punctuation.
See this exact question answered at other band scores. The same prompt compared across bands.
Browse more IELTS Writing model answers or get your own writing scored by the same AI examiner.