Band 5.0 IELTS Writing Task 1 Model Answer
Overall Band Score: 5.0 · Cambridge IELTS 17 · 2026-11-05
IELTS Writing Task 1 question
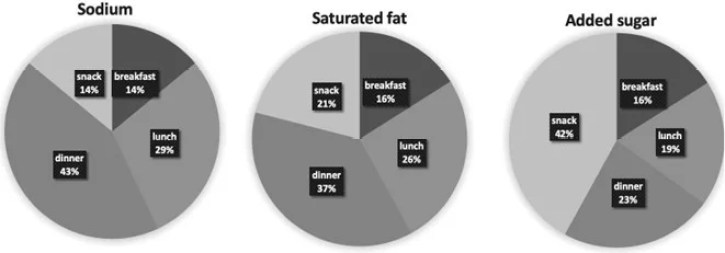
The charts below show the average percentages in typical meals of three types of nutrients, all of which may be unhealthy if eaten too much.
Summarise the information by selecting and reporting the main features, and make comparisons where relevant.
Average percentages of sodium, saturated fats and added sugars in typical meals consumed in the USA
Student answer (Band 5.0)
These charts illustrate the normal percentages of three type of nutrients wihich maybe cause unhealthy if intake too much.
Overall, in USA there are three kind of nutrients which shows the unhealthy paln if eaten too much. Firstly, its sodium nutrient and they have four portion of meals mentioned with percentages. Secondly, Its saturated fat and they have fours parts of meal discuss with percentages. Lastly, added sugar alos have four various sections targeted with percentages.
In these chart we discuused snak part of sodium, saturated fat and added sugar. In sodium snak contain 14%. Saturated fat consume 21% and the added sugar conatins large amount number of 42% in USA. On the right top is the breakfast section and in sodium the amount of percentage is 14% and its comparetively low then others. Saturated fat also have 16% amount in breakfast meal and the added sugar percentage is same as well.
On the bottom left there's a night meal dinner and in sodium nutrient its consume larhe number of amount 43%. Saturated fat is falling low in dinner meal conatins 37% meanwhile added sugar in dinner consume 23%. In USA the lunch consumed 29% and the saturaed fat and adde sugar qaunity is less then lunch 26% and 19%. So its unhelathy meals if they conatins these number of percentages eaten too much amount of these are effected and cause of dangerous health issues.
AI examiner evaluation
| Criterion | Band |
|---|---|
| Task Achievement / Task Response | 5.0 |
| Coherence and Cohesion | 5.0 |
| Lexical Resource | 4.5 |
| Grammatical Range and Accuracy | 5.0 |
| Overall | 5.0 |
Task Achievement / Task Response: Band 5.0
You identify the three nutrients and report several relevant figures, including sodium at dinner (43%), added sugar in snacks (42%), and the breakfast values. These details show some understanding of the charts. However, the overview mainly lists the chart categories rather than summarising the key patterns. The most important contrast is that dinner has the highest sodium and saturated-fat shares, while snacks have the highest added-sugar share; this is not clearly stated as an overall finding. Some comparisons are also unclear, such as “the sodium amount … is comparatively low then others,” and the lunch sentence does not clearly identify which meal each percentage refers to. Focus on the main highs and lows, then support them with accurate, clearly attributed figures.
Coherence and Cohesion: Band 5.0
The response has separate paragraphs and attempts to guide the reader with “Overall,” “Firstly,” “Secondly,” and references to chart positions. This gives it some basic organisation. However, there is no clear progression from a concise overview to systematically grouped comparisons: the second paragraph lists categories, while later paragraphs move between snacks, breakfast, dinner, and lunch. Some linking language is repetitive or does not clarify relationships, and phrases such as “the lunch consumed 29%” leave the nutrient unclear. Organise the report around the main patterns—for example, compare meal shares for sodium and saturated fat, then contrast these with added sugar—and use clear references to the nutrient and meal in each comparison.
Lexical Resource: Band 4.5
You use some relevant chart vocabulary, including “percentages,” “nutrients,” “breakfast,” and “dinner,” so the topic is generally recognisable. However, the range is limited and several word choices or collocations make the meaning difficult to follow. Expressions such as “normal percentages,” “four portion of meals,” “large amount number,” and “falling low” are not natural ways to describe chart data. There are also frequent spelling errors, including “snak,” “conatins,” and “saturaed,” which reduce clarity. Build a small set of accurate reporting phrases, such as “accounted for,” “the highest proportion,” and “compared with,” and check spelling carefully before submitting.
Grammatical Range and Accuracy: Band 5.0
You attempt both short statements and longer comparisons, and the reader can often identify the intended meal and percentage. However, sentence structures are limited, and attempts to combine ideas frequently contain errors in agreement, articles, plurals, and sentence construction. For example, “three type of nutrients … maybe cause unhealthy” lacks accurate plural and verb patterns, while “Saturated fat consume 21%” does not form a correct subject–verb structure. The final sentence also joins several ideas without a clear grammatical relationship. Practise reliable patterns such as “Dinner accounted for 43% of sodium intake” and “The figure for added sugar was 23%,” then use these consistently before attempting longer comparisons.
See this exact question answered at other band scores. The same prompt compared across bands.
Browse more IELTS Writing model answers or get your own writing scored by the same AI examiner.