Band 5.5 IELTS Writing Task 1 Model Answer
Overall Band Score: 5.5 · Cambridge IELTS 17 · 2026-11-11
IELTS Writing Task 1 question
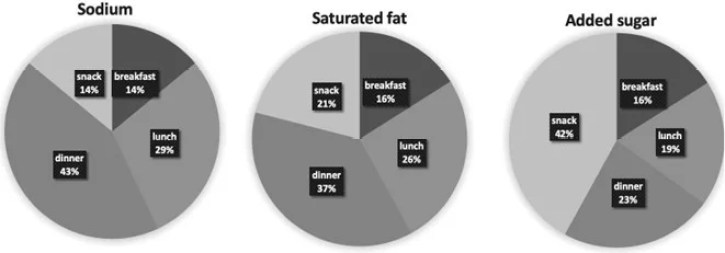
The charts below show the average percentages in typical meals of three types of nutrients, all of which may be unhealthy if eaten too much.
Summarise the information by selecting and reporting the main features, and make comparisons where relevant.
Average percentages of sodium, saturated fats and added sugars in typical meals consumed in the USA
Student answer (Band 5.5)
The three pie charts illustrates the average percentages in classical meals in USA of three different nutrients sodium, saturated fat, and added sugar and they can be harmful if eaten too much.
Firstly, the average percentage of sodium eaten in dinner stood at 43%, which marks the highest figure followed in lunch by 29%. And the average percentage of sodium eaten in breakfast and snack was same about 14%.
Secondaly, the average ratio of saturated fat eaten in dinner stood at 37%, which marks the highest figure followed in lunch by 26% and consumed snack is about 21%.Whereas, the average ratio of saturated fat consumed in breakfast is 16%, which marks the lowest figure.
Lastly, the average ratio of added sugar consumed in snack stood at 42%, which marks the highest figure while, in dinner it is about 23%. While, in lunch it is about 19% and the percentage of added sugar eaten in breakfast was same as saturated fat about 16% whereas, it also marks the lowest figure.
AI examiner evaluation
| Criterion | Band |
|---|---|
| Task Achievement / Task Response | 5.0 |
| Coherence and Cohesion | 6.5 |
| Lexical Resource | 5.5 |
| Grammatical Range and Accuracy | 5.5 |
| Overall | 5.5 |
Task Achievement / Task Response: Band 5.0
You report several key figures accurately, including dinner as the highest source of sodium (43%) and saturated fat (37%), and snacks as the largest source of added sugar (42%). However, the response mainly lists figures meal by meal and does not provide a clear overall summary of the most important patterns across the charts. For example, it does not explicitly contrast dinner’s prominence for sodium and saturated fat with snacks’ prominence for added sugar. Some comparisons are also incomplete: breakfast and snacks are tied for sodium, but this is not set against the other meals in an overview. A concise opening overview identifying these broad contrasts, followed by selected supporting figures, would make the main features clearer and more fully address the task.
Coherence and Cohesion: Band 6.5
The response has a clear basic sequence: an introduction followed by separate paragraphs beginning “Firstly,” “Secondaly,” and “Lastly,” which helps readers follow the three nutrients. Most figures are grouped with the relevant nutrient, and the progression is easy to identify. However, the organisation is largely a repeated list rather than a comparison of the charts, and linking is sometimes mechanical. The final paragraph uses “while” and “whereas” repeatedly without making the relationships between meals especially clear. There is also no distinct overview paragraph to guide the reader to the main patterns. To strengthen progression, add an overview after the introduction and use comparisons that connect the charts, rather than relying mainly on ordinal transitions.
Lexical Resource: Band 5.5
You use enough chart-related vocabulary to communicate the data, including “highest figure,” “lowest figure,” “percentage,” and “consumed.” However, the range is limited by repeated phrases such as “average percentage” and “stood at,” and some choices are unnatural or imprecise: “classical meals” does not describe the chart’s typical meals, while “average ratio” is not the best term for these percentages. There are also spelling errors, notably “Secondaly,” and the phrase “marks the highest figure” is awkward in this context. Aim for more precise, varied reporting language, such as “accounted for,” “the largest share,” and “meal.” These improvements would make the description more natural while preserving the clear meaning of most of your vocabulary.
Grammatical Range and Accuracy: Band 5.5
You attempt both simple and more extended sentence forms, and the reader can generally understand the comparisons. However, errors in sentence structure and punctuation recur. The opening sentence has subject–verb disagreement in “The three pie charts illustrates,” and the phrase “in USA” is missing an article. In “followed in lunch by 29%,” the comparison is not formed clearly, while “Whereas” and “While” are sometimes used as sentence openings without a complete independent clause. Punctuation is also inconsistent, as in “21%.Whereas,” and the final sentence contains several clauses joined without clear boundaries. Practise accurate agreement, articles, and complete clause structures, then separate longer comparisons into well-punctuated sentences.
See this exact question answered at other band scores. The same prompt compared across bands.
Browse more IELTS Writing model answers or get your own writing scored by the same AI examiner.