Band 6.0 IELTS Writing Task 1 Model Answer
Overall Band Score: 6.0 · Cambridge IELTS 17 · 2026-11-15
IELTS Writing Task 1 question
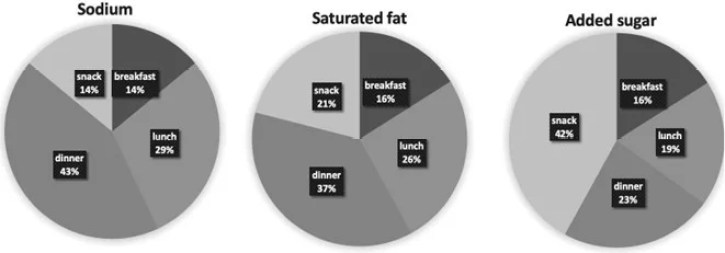
The charts below show the average percentages in typical meals of three types of nutrients, all of which may be unhealthy if eaten too much.
Summarise the information by selecting and reporting the main features, and make comparisons where relevant.
Average percentages of sodium, saturated fats and added sugars in typical meals consumed in the USA
Student answer (Band 6.0)
These pie charts illustrates the average percentage in typical meals of Sodium , Saturated fat and Added sugar ,if eaten too much all these may be unhealthy.
Overall, The dinner showed a high proportion in first two while, the breakfast shows a low figure in all three types of nutrients.
Dinner consumed 43% sodium which is largest in all three, In Saturated fat it is shown as 37% and in Added sugar it is 23%. Sodium is found in lunch at 29% , 26% in saturated fat and a low figure of 19% in Added sugar.
In snack Sodium is reported at 14% , while in saturated fat at 21% and a highest number of added sugar is seen in snack at 42% . Moreover, breakfast utilized 14% Sodium which is lowest in these three types of nutrients while in Saturated fat it is 16% and in added sugar breakfast is also with same number at 16%.
AI examiner evaluation
| Criterion | Band |
|---|---|
| Task Achievement / Task Response | 6.5 |
| Coherence and Cohesion | 6.0 |
| Lexical Resource | 5.5 |
| Grammatical Range and Accuracy | 5.5 |
| Overall | 6.0 |
Task Achievement / Task Response: Band 6.5
You cover all three nutrients and all four meals, and the figures you report match the chart. The overview identifies dinner as high for sodium and saturated fat and breakfast as low overall; the body also correctly highlights the 42% added-sugar figure for snacks. This gives the response a clear account of the main patterns. To make the summary more fully developed, state the key contrast across the charts explicitly: dinner is the largest source of sodium and saturated fat, whereas snacks are the largest source of added sugar. The claim that breakfast is low in all three is broadly supported, but it would be more precise to note that breakfast and snacks tie for the lowest sodium share. These refinements would make the overview more selective and precise.
Coherence and Cohesion: Band 6.0
The response has a recognisable structure: an introduction, an overview, and paragraphs reporting meal figures. The information is generally easy to follow, and grouping the figures by meal gives the reader a consistent route through the data. However, the progression is somewhat mechanical, with each meal introduced in a similar way and several figures listed without a clear comparative link. For example, the dinner and lunch paragraph could more directly contrast their shares, while the snack paragraph could connect the 42% sugar figure to the lower values for the other nutrients. Use linking and reference more precisely, and ensure paragraph breaks separate the overview from the detailed comparisons cleanly.
Lexical Resource: Band 5.5
You use relevant chart vocabulary, including “proportion,” “figure,” and “consumed,” and the nutrient names are clear throughout. The range is sufficient to describe the data, but some word choices and collocations are awkward or repetitive. “Dinner showed a high proportion” is less natural than saying dinner “accounted for” a high share, and “a highest number” is not an appropriate way to describe a percentage. “Utilized” also suggests deliberate use rather than the amount of a nutrient in a meal. Aim for precise reporting verbs and vary repeated phrases such as “is shown” and “is reported.” These changes would make the description more fluent and appropriately formal.
Grammatical Range and Accuracy: Band 5.5
You attempt both simple and more developed sentence forms, and the meaning of the figures is usually recoverable. Some grammatical errors remain, particularly with agreement, articles, and sentence boundaries. The opening “These pie charts illustrates” has a plural subject with a singular verb; it should be “These pie charts illustrate.” In “the breakfast shows a low figure,” the article is unnecessary, and “while, the breakfast” has incorrect punctuation around the conjunction. Several data statements are joined with commas rather than being formed as complete, well-punctuated sentences. Check subject–verb agreement and use full stops or semicolons to separate independent clauses. Greater control of these patterns would improve accuracy.
See this exact question answered at other band scores. The same prompt compared across bands.
Browse more IELTS Writing model answers or get your own writing scored by the same AI examiner.