Band 6.0 IELTS Writing Task 1 Model Answer
Overall Band Score: 6.0 · Cambridge IELTS 17 · 2026-11-19
IELTS Writing Task 1 question
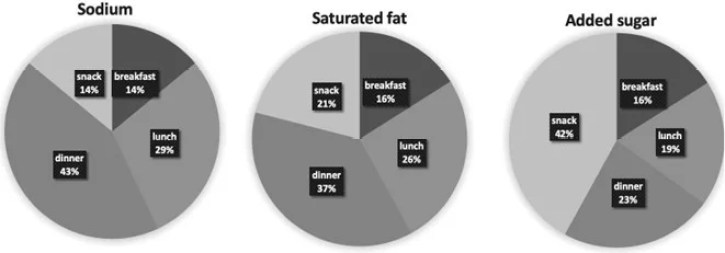
The charts below show the average percentages in typical meals of three types of nutrients, all of which may be unhealthy if eaten too much.
Summarise the information by selecting and reporting the main features, and make comparisons where relevant.
Average percentages of sodium, saturated fats and added sugars in typical meals consumed in the USA
Student answer (Band 6.0)
The three pie charts demonstrates the average percentage of consumption of three types meals of three types of nutrients such as sodium, saturated fat and added sugar in the USA.
Overall, sodiuma and saturated fat are mostly consumed at dinner and added sugar are mostly eaten during snack time that is almost half of the portion of added sugar chart.
By looking at the charts, at dinner highest level of sodium is consumed that is 43% followed by saturated fat that is consumed about 37% .The second highest of sodium nutrients food and saturated fat food eaten at lunch that is 29% and 26% respectively. On the other hand, at dinner only 23% added sugar is consumedand and only 19% of sugar is consumed during lunch time.
In addition, compared to added sugar at snack only 14% sodium and 21% saturated fat is consumed where as in terms of sugar 42% is consumed during that time indicating people eat more sugar in snack meals. The consumption of sodium , saturated fat and added sugar are less compared to the other meals as 14% people consume sodium in breakfast meals and both saturared fat and sugar accounts for 16% of their respective charts.
AI examiner evaluation
| Criterion | Band |
|---|---|
| Task Achievement / Task Response | 7.0 |
| Coherence and Cohesion | 6.5 |
| Lexical Resource | 5.5 |
| Grammatical Range and Accuracy | 5.5 |
| Overall | 6.0 |
Task Achievement / Task Response: Band 7.0
You identify the main patterns accurately: dinner has the highest shares of sodium and saturated fat, while snacks account for the largest proportion of added sugar. The figures you report—43% and 37% at dinner, 29% and 26% at lunch, and 42% sugar in snacks—match the charts. You also include breakfast and make relevant comparisons across meals, so the key features are covered and supported with data. The overview is clear, although “almost half” is a slightly broad description of 42%, and the final claim that consumption is “less compared to the other meals” is imprecise because breakfast ties with snacks for sodium. More exact comparisons and a concise summary of the overall contrasts would make the report more consistently precise.
Coherence and Cohesion: Band 6.5
The response has a recognisable structure: an introduction, an overview, and two paragraphs presenting comparisons. The progression from the dinner and lunch figures to snacks and breakfast is generally logical, and linking expressions such as “Overall,” “followed by,” and “On the other hand” help guide the reader. This gives the report a coherent overall arrangement. However, some connections are awkward or repetitive, particularly the repeated use of “consumed” and the long final sentence, which combines several comparisons without a clear hierarchy. The phrase “The second highest of sodium nutrients food…” also makes the relationship between the figures difficult to follow. Use shorter, more clearly grouped comparisons and ensure each paragraph has a distinct focus to make cohesion more flexible and precise.
Lexical Resource: Band 5.5
You use relevant chart vocabulary, including “average percentage,” “followed by,” “respectively,” and “compared to,” and the reader can generally understand the comparisons. However, the range is limited and several word choices or collocations are noticeably inaccurate. “Three types meals of three types of nutrients” confuses meals with nutrients, while “sodium nutrients food” and “saturated fat food” are not natural ways to describe the data. There are also spelling and spacing problems, such as “sodiuma,” “saturared,” and “consumedand.” These errors reduce precision and sometimes slow the reader, even though the intended meaning is usually recoverable. Aim for accurate, varied terms such as “proportion,” “share,” and “account for,” rather than repeatedly relying on “consumed.”
Grammatical Range and Accuracy: Band 5.5
You attempt a range of sentence forms, including an overview sentence and comparisons using “followed by” and “whereas.” However, control is inconsistent, and errors occur in both simple and more complex structures. For example, “The three pie charts demonstrates” has subject–verb disagreement, while “added sugar are mostly eaten” also has incorrect agreement. The opening phrase “percentage of consumption of three types meals” has a faulty grammatical structure, and “The second highest of sodium…” does not form a clear sentence. Punctuation and spacing are also uneven, with missing spaces before full stops and commas. Practise building accurate comparison sentences with clear subjects and verbs, then check agreement and punctuation during revision.
See this exact question answered at other band scores. The same prompt compared across bands.
Browse more IELTS Writing model answers or get your own writing scored by the same AI examiner.