Band 5.5 IELTS Writing Task 1 Model Answer
Overall Band Score: 5.5 · Cambridge IELTS 17 · 2026-11-19
IELTS Writing Task 1 question
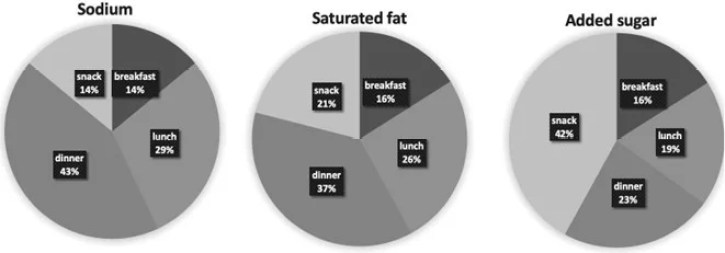
The charts below show the average percentages in typical meals of three types of nutrients, all of which may be unhealthy if eaten too much.
Summarise the information by selecting and reporting the main features, and make comparisons where relevant.
Average percentages of sodium, saturated fats and added sugars in typical meals consumed in the USA
Student answer (Band 5.5)
The pie chart illustrates the average percentage of three types of nutrients (sodium, saturated fats, added sugar) in different meals consumed in the usa.
Overall, the percentage of saturated fats and added sugar in snacks increased, while in lunch and dinner it decreased over the period given. At the start of the period, the proportion of sodium in dinner is the highest, while snacks and breakfast are the lowest.
In snacks, the percentage of added sugar accounted for almost 42%, double as compare with saturated fat at 21% and the sodium almost 14%. Interestingly, the proportion of added sugar and saturated fat in breakfast is 16%, which is the highest, as opposed to sodium in breakfast at 14%.
In dinner, the percentage of sodium is 43%, saturated fat is 37%, and added sugar is almost 23%
In dinner, the percentage of added sugar is almost 23%, decreasing as compared with saturated fat and sodium (37% and 43%).
The proportion of added sugar in lunch is 19%, decreasing as opposed to saturated fat (26%) and sodium (29%)
AI examiner evaluation
| Criterion | Band |
|---|---|
| Task Achievement / Task Response | 5.5 |
| Coherence and Cohesion | 5.0 |
| Lexical Resource | 5.5 |
| Grammatical Range and Accuracy | 5.5 |
| Overall | 5.5 |
Task Achievement / Task Response: Band 5.5
You identify the three nutrients and report several key figures accurately, including dinner’s high sodium share (43%) and the snack share for added sugar (42%). However, the overview is partly inaccurate: these are meal comparisons, not changes “over the period,” and the chart shows no increase or decrease over time. The claim that saturated fat and added sugar in snacks “increased” is therefore unsupported. You also say breakfast has the highest proportions of added sugar and saturated fat, although both are tied at 16% with breakfast’s values, not the highest across meals. The response includes useful comparisons, but the overview and coverage of lunch and breakfast need clearer, accurate synthesis of the main patterns.
Coherence and Cohesion: Band 5.0
The response has an introduction, an overview and detail paragraphs, so there is some organisation. However, progression is weakened by the repeated dinner information: the sentence beginning “In dinner, the percentage of sodium is 43%” is followed by another sentence restating the same figures. The overview’s reference to a “period” also gives the reader an incorrect framework for the comparisons. Linking expressions such as “while,” “as opposed to” and “Interestingly” are used, but some relationships are unclear or repetitive. Group the information by the most meaningful patterns—for example, dinner’s high sodium and saturated fat shares versus snacks’ high added sugar—and avoid repeating figures. This would make the sequence easier to follow.
Lexical Resource: Band 5.5
You use relevant chart vocabulary, including “proportion,” “accounted for” and “percentage,” and the nutrient names are generally clear. However, some word choices and collocations are inaccurate or awkward, such as “increased” and “decreased over the period,” which imply a time trend absent from the chart, and “double as compare with.” “At the start of the period” similarly misrepresents the data. There is also repetition of “percentage” and “proportion,” and “usa” should be capitalised as “USA.” Aim for precise language for static comparisons, such as “was higher than,” “made up” or “accounted for,” and vary reporting verbs without implying change over time.
Grammatical Range and Accuracy: Band 5.5
The response includes some straightforward sentence forms and attempts longer comparisons, but control is uneven. For example, “double as compare with saturated fat” has an incorrect comparative construction, while “the proportion … is 16%” shifts into the present tense inconsistently with the surrounding past-tense reporting. The overview’s “the proportion … is the highest” also has an unclear comparison structure. Several sentences are fragments or lack final punctuation, particularly the last three lines, and the repeated dinner statements are not joined into a well-controlled paragraph. Use consistent past tense for reporting the chart, form comparisons accurately (“twice the figure for”), and punctuate each complete sentence. These changes would improve accuracy while retaining the range of structures attempted.
See this exact question answered at other band scores. The same prompt compared across bands.
Browse more IELTS Writing model answers or get your own writing scored by the same AI examiner.