Band 5.5 IELTS Writing Task 1 Model Answer
Overall Band Score: 5.5 · IELTS Academic Practice Accelerator · 2026-11-15
IELTS Writing Task 1 question
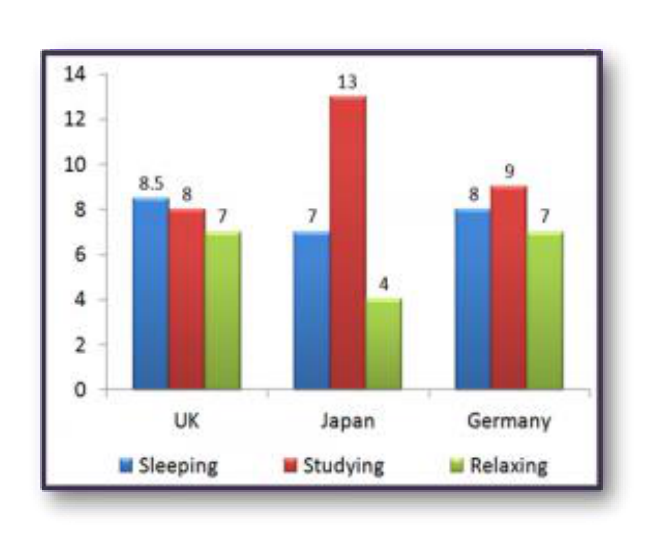
The bar chart shows the typical weekday for students in three different countries.
Summarise the information by selecting and reporting the main features, and make comparisons where relevant.
Student answer (Band 5.5)
The bar compares the total numbers of three different countries students typical days in weekdays, while the bar chart illustrate the three different things, including sleeping, studying and relaxing.
Overall japan experinced increased in the bar as compared to uk and germany with higher propotion of typical weekdays in students, then germany have significant nuumbers and in the last uk has some satisfying numbers.
In japan studying of students has the highest numbers of 13 while germany has 9 in it and uk has 8, In sleeping uk has highest of 8.5 and germany has 7 and japand has 7. In relaxing uk and germnay has same 7 but japan has lowest among then of 4.
In contrast japan students working really hard in studies as compared to germany and uk but uk students habving more good sleep as compared to japan and germany and germany students are more relaxed towards their routine as compared to japan and uk students.
AI examiner evaluation
| Criterion | Band |
|---|---|
| Task Achievement / Task Response | 6.0 |
| Coherence and Cohesion | 6.0 |
| Lexical Resource | 5.0 |
| Grammatical Range and Accuracy | 5.0 |
| Overall | 5.5 |
Task Achievement / Task Response: Band 6.0
You identify the main categories and make several relevant comparisons, including Japan’s peak of 13 hours for studying and the equal seven-hour relaxation figures for the UK and Germany. These details show a reasonable understanding of the chart. However, the overview is unclear and partly inaccurate: saying Japan had a higher “proportion of typical weekdays” does not specify that its study time was highest, and the claim that Germany had “significant numbers” is vague. There is also a factual error in stating that Japan slept for seven hours; the chart gives seven hours for Japan, but Germany slept for eight. The final comparisons about students working hard or being more relaxed go beyond what the chart directly establishes. Select the key patterns and report them neutrally and precisely.
Coherence and Cohesion: Band 6.0
The response has a recognisable overall structure: an introduction, an overview, a paragraph comparing the figures, and a concluding comparison. This gives the reader a basic route through the information. Some progression is weakened by unclear or mechanical connections, however. The overview’s sequence—“then germany” and “in the last uk”—does not clearly explain the ranking, while “In contrast” introduces a summary of interpretations rather than a distinct contrast in the data. The long comparison sentence beginning “In japan studying” also places several figures together without clear punctuation or grouping. Organise the body around the main patterns, such as study time first and sleep and relaxation together, and use linking phrases only where they clarify the relationship between points.
Lexical Resource: Band 5.0
You use some task-relevant vocabulary, including “studying,” “sleeping,” “relaxing,” “highest,” and “lowest,” so the reader can generally identify the categories and comparisons. However, the range and control are limited, and several word choices or collocations make the report unclear. For example, “increased in the bar” does not describe the chart accurately, while “satisfying numbers” and “significant numbers” are vague. There are also noticeable spelling errors, such as “experinced,” “propotion,” “japand,” and “germnay.” Aim for precise chart language such as “recorded,” “spent,” and “stood at,” and check spelling carefully. Avoid interpreting the figures as evidence that students are “working really hard”; report the measured hours instead.
Grammatical Range and Accuracy: Band 5.0
You attempt both simple statements and longer comparative sentences, and the main categories and many figures remain understandable. However, control is uneven, particularly in sentence construction and agreement. The opening sentence, “The bar compares the total numbers of three different countries students typical days,” is difficult to parse because the relationships between the nouns are not expressed clearly. In “the bar chart illustrate,” the subject and verb do not agree, and “germany have” has the same problem. Capitalisation and punctuation are also inconsistent, especially in the long sentence listing study, sleep, and relaxation figures. Practise clear patterns such as “The chart compares the number of hours students spend…” and use separate, complete sentences for each comparison. This will let you show a wider range without losing accuracy.
See this exact question answered at other band scores. The same prompt compared across bands.
Browse more IELTS Writing model answers or get your own writing scored by the same AI examiner.