Band 5.5 IELTS Writing Task 1 Model Answer
Overall Band Score: 5.5 · IELTS Academic Practice Accelerator · 2026-11-05
IELTS Writing Task 1 question
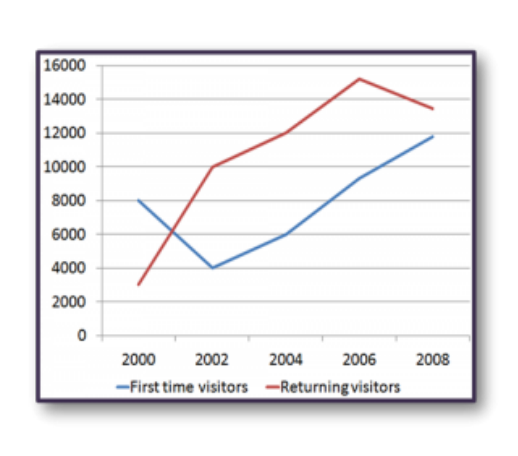
The line graph shows the number of first time visitors and returning visitors who visited Caryl Island from 2000 to 2008.
Summarise the information by selecting and reporting the main features, and make comparisons where relevant.
The line graph shows the number of first time visitors and returning visitors who visited Caryl Island from 2000 to 2008.
Student answer (Band 5.5)
The line graph shows the number of first time visitors and returning visitors who visited Caryl Island from 2000 to 2008
The Graph indicates the number of individuals who first time visited the Caryl Island and the visitors who returned from the Island from the year 2000- 2008
the people who visited in the year 2000 were about 8000 then in 2002 the visitors were reduced by 4000 and in the year 2004, 6000 individuals visted the Island and in 2006 the rate of individuals were increased upto 10000 which was a huge rise in the visitors and in the year [redacted phone]0 were the visitors who visited Caryl Island.
Then the visitors who were returning back from The Caryl Island were almost 3000 in the year 2000,
later a rise in returning of individuals were seen in the year 2002 then in the year [redacted phone]0 were returned and the highest record was made in the year 2006 nearly 15000 vistors were returning back from Caryl Island and then later it was reduced to almost 13000 in the year 2008.
As were can see the Graph and understand that the average of returning visitors were increased as the time was passing by.
AI examiner evaluation
| Criterion | Band |
|---|---|
| Task Achievement / Task Response | 5.0 |
| Coherence and Cohesion | 5.5 |
| Lexical Resource | 5.5 |
| Grammatical Range and Accuracy | 5.0 |
| Overall | 5.5 |
Task Achievement / Task Response: Band 5.0
You cover both visitor groups and report the broad direction of change, including the rise in returning visitors to a peak in 2006 and their subsequent decline. Several figures are also close to the chart. However, the response does not clearly establish the main comparison: returning visitors outnumbered first-time visitors from 2002 onward, while first-time visitors fell initially and then rose steadily. The statement that the “average of returning visitors were increased” is unclear and does not provide a precise overview. Some figures are imprecise, such as 10,000 rather than about 9,300 for first-time visitors in 2006, and the 2002 returning figure is mentioned only as a rise. Select the key contrasts and summarise them accurately.
Coherence and Cohesion: Band 5.5
The response has a basic overall structure: an introduction, a paragraph about first-time visitors, a paragraph about returning visitors, and a final comment. This makes the two series reasonably easy to distinguish. However, progression within the paragraphs is often a list of years and figures joined repeatedly by “then” and “in the year,” so the relationships between changes are not developed smoothly. The opening repeats the task wording rather than moving directly into a clear overview, and the final sentence is vague. Use a concise overview after the introduction, then group related trends and comparisons. More varied, accurate linking and clearer references would make the organisation feel less repetitive.
Lexical Resource: Band 5.5
You use some relevant vocabulary for describing trends, including “rise,” “reduced,” “highest record,” and “increased,” and the meaning is generally recoverable. However, the range is limited and several expressions are awkward or imprecise, such as “visitors were reduced by 4000,” “returning back,” and “the average … were increased.” These choices sometimes make it unclear whether you mean visitor numbers or individual visitors. There are also spelling errors, including “visted” and “vistors,” and inconsistent capitalisation of “Graph” and “Island.” Aim for precise chart language and accurate collocations, such as describing numbers as falling, rising, peaking, or declining.
Grammatical Range and Accuracy: Band 5.0
The response attempts longer sentences to describe changes over time, but these are often joined with repeated “and” and contain frequent grammatical problems. For example, “the visitors were reduced by 4000” uses an unsuitable passive construction, while “the average of returning visitors were increased” has problems with both sentence structure and subject–verb agreement. The opening description, “individuals who first time visited,” also has an inaccurate word order and verb form. Punctuation is inconsistent, with long sentences that need clearer boundaries. Practise forming accurate comparisons and trend sentences, using structures such as “the number of first-time visitors fell to…” and “returning visitors peaked at…”.
See this exact question answered at other band scores. The same prompt compared across bands.
Browse more IELTS Writing model answers or get your own writing scored by the same AI examiner.