Band 6.0 IELTS Writing Task 1 Model Answer
Overall Band Score: 6.0 · IELTS Academic Practice Accelerator · 2026-11-06
IELTS Writing Task 1 question
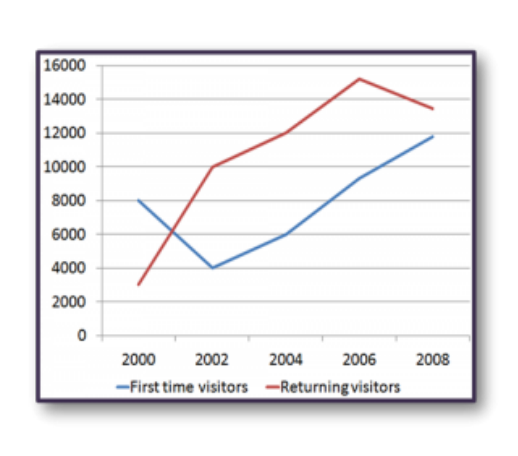
The line graph shows the number of first time visitors and returning visitors who visited Caryl Island from 2000 to 2008.
Summarise the information by selecting and reporting the main features, and make comparisons where relevant.
The line graph shows the number of first time visitors and returning visitors who visited Caryl Island from 2000 to 2008.
Student answer (Band 6.0)
The line chart delineates the number of tourists who visited for the first time and those who returned after visiting Caryl Island from year 2000 to 2008.
Overall, the number of returning visitors are more in contrast to first time visitors over the timeframe of 8 years.
There is a steep decrease in number of first-time visitors in first two years. Eventually dropping to the half of initial visitor`s number. Afterwards an overall increasing trend is seen which grows gradually and steadily. Finally, enclosing at 12000 number of visitors by the end of 2008.
Looking at the line of returning visitors it is clearly inferred from chart that in first two years there is a steep rise in number of returning visitors. Then from year 2002 onwards there is a gradual increasing trend is observed, until the end of 2006.In last two years, a declining steep is observed which indicates a decreasing trend of returning visitors.
AI examiner evaluation
| Criterion | Band |
|---|---|
| Task Achievement / Task Response | 6.0 |
| Coherence and Cohesion | 6.5 |
| Lexical Resource | 5.5 |
| Grammatical Range and Accuracy | 5.5 |
| Overall | 6.0 |
Task Achievement / Task Response: Band 6.0
You identify the two visitor groups and describe the main overall pattern: returning visitors were generally more numerous, while first-time visitors fell before rising. Several details are also broadly accurate, including the sharp early rise in returning visitors and their decline after 2006. However, some figures and comparisons are imprecise: first-time visitors finish at about 11,800, rather than 12,000, and returning visitors peak at about 15,200 in 2006 before falling to around 13,400. The overview also overgeneralises that returning visitors were more numerous throughout; first-time visitors exceeded returning visitors in 2000. To strengthen the report, include a clearer comparison of the starting and ending figures and describe the peak and crossover accurately.
Coherence and Cohesion: Band 6.5
The response has a clear overall arrangement: an introduction, an overview, and separate descriptions of the two lines. This makes the main progression easy to follow, and time markers such as “Afterwards,” “Finally,” and “from year 2002 onwards” help signal changes. This meets the lower-band expectation of coherent organisation and shows some effective progression. However, the linking is occasionally mechanical, and the first-time visitor paragraph contains a fragment beginning “Eventually dropping…”. The final paragraph also moves through several stages without giving exact comparisons, while “in first two years” is repeated across both descriptions. Use complete sentences and connect the series through direct comparisons, for example, noting when returning visitors overtook first-time visitors.
Lexical Resource: Band 5.5
You use a reasonable range of topic vocabulary, including “steep decrease,” “gradually,” “increasing trend,” and “declining,” so the reader can understand the broad movements. There are also attempts at more formal reporting language, such as “delineates” and “inferred.” However, some choices are unnatural or imprecise for describing a graph: “enclosing at 12000,” “a declining steep,” and “the number of returning visitors are more” do not express the intended meaning naturally. “Delineates” is also an awkward choice for introducing what a chart shows. Aim for accurate, conventional collocations rather than more elaborate wording; phrases such as “ended at,” “a sharp decline,” and “the figure was higher” would make the description clearer and more controlled.
Grammatical Range and Accuracy: Band 5.5
You attempt both simple and more complex sentence forms, including clauses introduced by “which” and time expressions such as “until the end of 2006.” The overall meaning is usually recoverable, but some grammatical errors remain. For example, “the number of returning visitors are” has subject–verb disagreement, and “there is a gradual increasing trend is observed” combines incompatible sentence structures. “Eventually dropping to the half…” is a sentence fragment, while “in first two years” and “from year 2002” need articles. Punctuation is also inconsistent, as in “2006.In last two years.” Work on complete sentence construction, agreement, and article use, and check spacing after full stops. These corrections would make your varied structures more consistently accurate.
See this exact question answered at other band scores. The same prompt compared across bands.
Browse more IELTS Writing model answers or get your own writing scored by the same AI examiner.